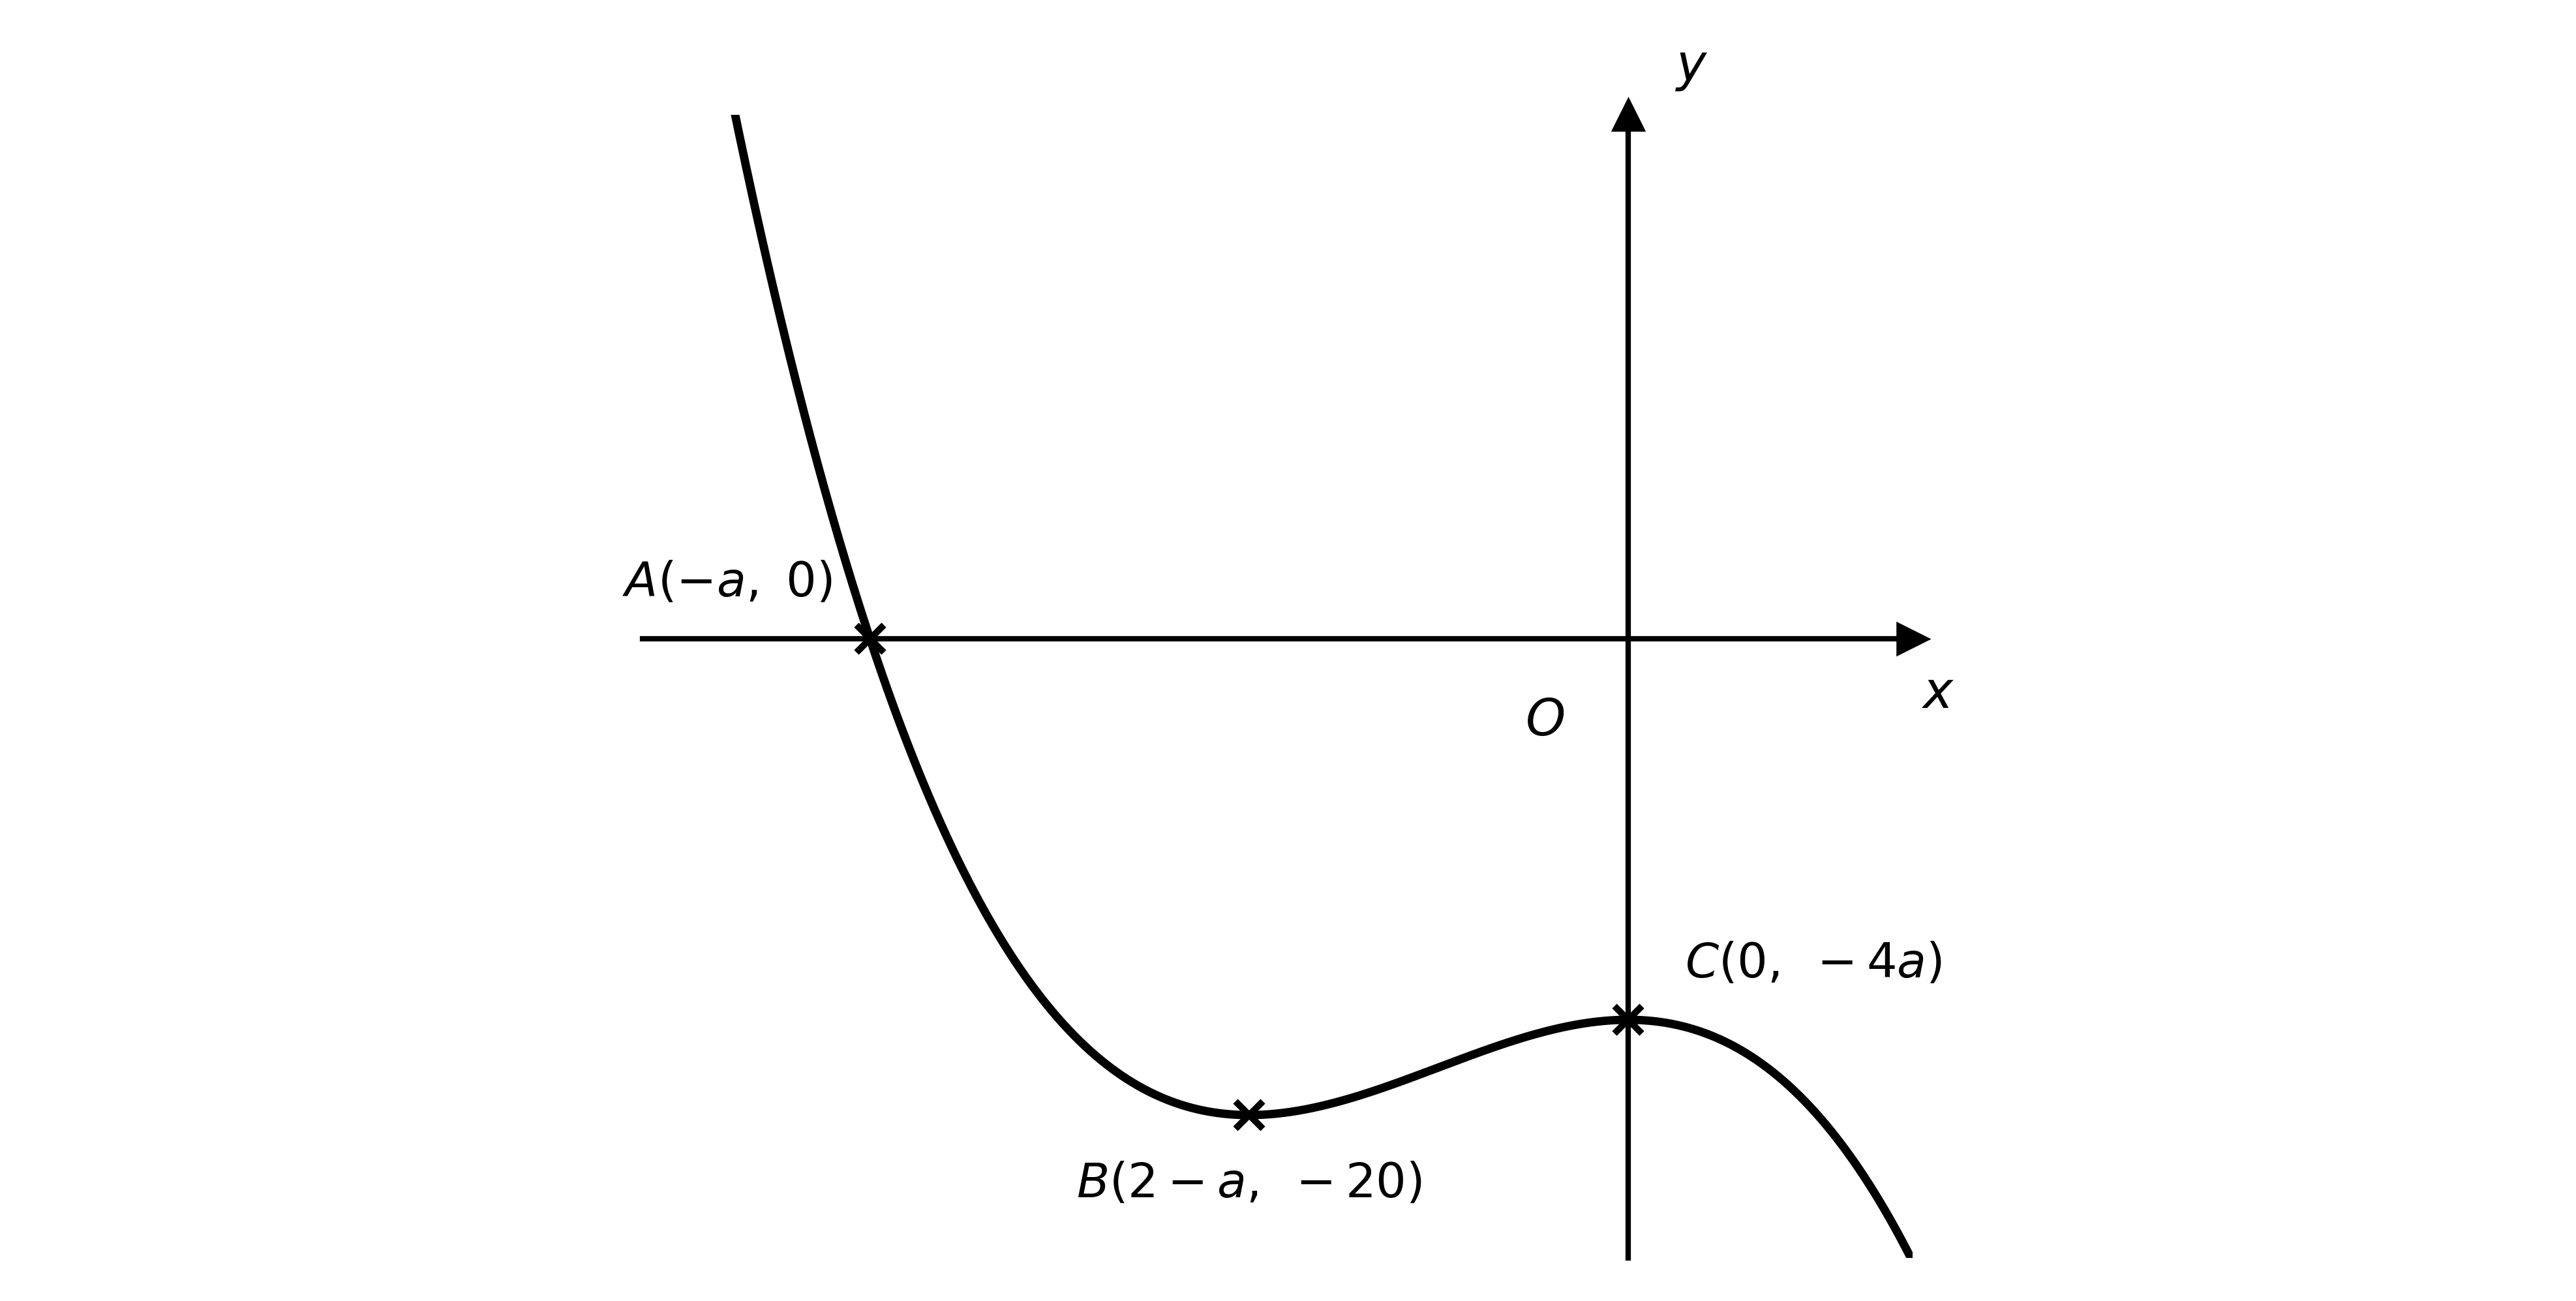
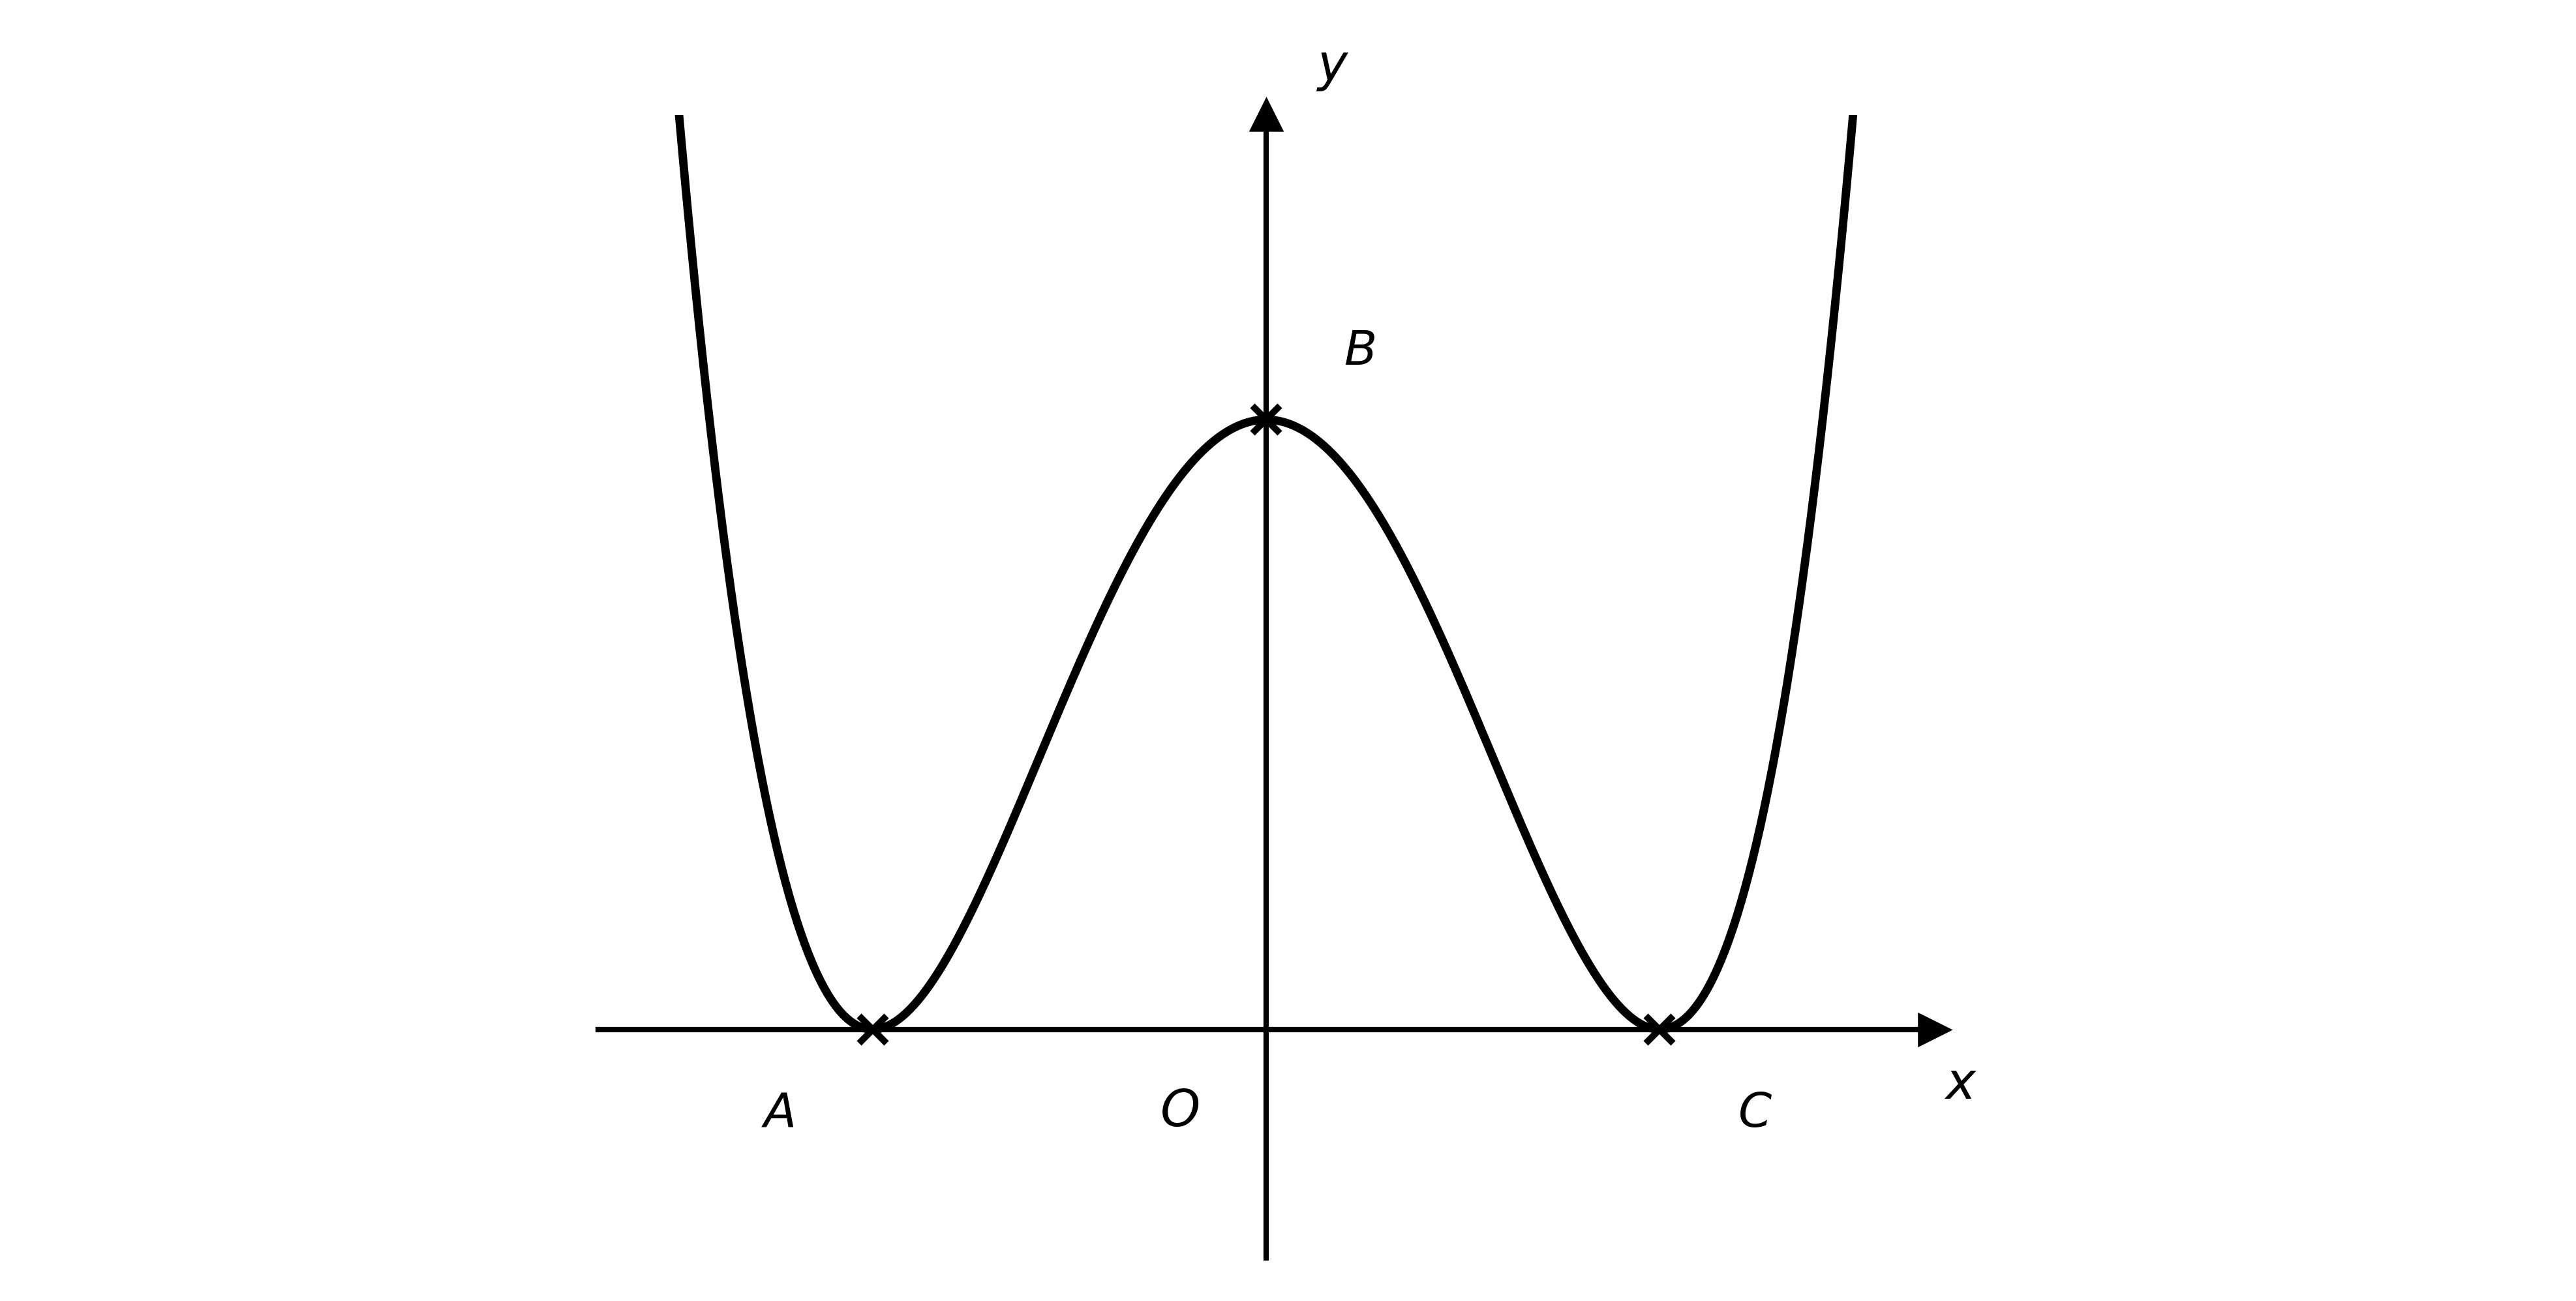
The diagram below shows the graph of .
The stationary point is marked on the diagram.

On separate diagrams, sketch the following graphs.
(i)
(ii)
On each diagram, state the coordinates of the image of point under the given transformation.
28 questions · 142 marks · ≈ 2 hours
The diagram below shows the graph of .
The stationary point is marked on the diagram.

On separate diagrams, sketch the following graphs.
(i)
(ii)
On each diagram, state the coordinates of the image of point under the given transformation.
The graph of is transformed. In each case, write down, in terms of , the equation of the resulting graph.
(i) a translation by \begin{pmatrix} -2 \\ 3 \end{pmatrix}
(ii) a horizontal stretch with scale factor 2, followed by a vertical stretch with scale factor 3
The function is defined by .
On the same diagram, sketch the graphs of and , and indicate the line of symmetry.
Label the coordinates of any point where the graphs cross the coordinate axes.
(i) Write down an expression for in terms of .
(ii) Find an expression for in terms of , and state the single transformation this represents.
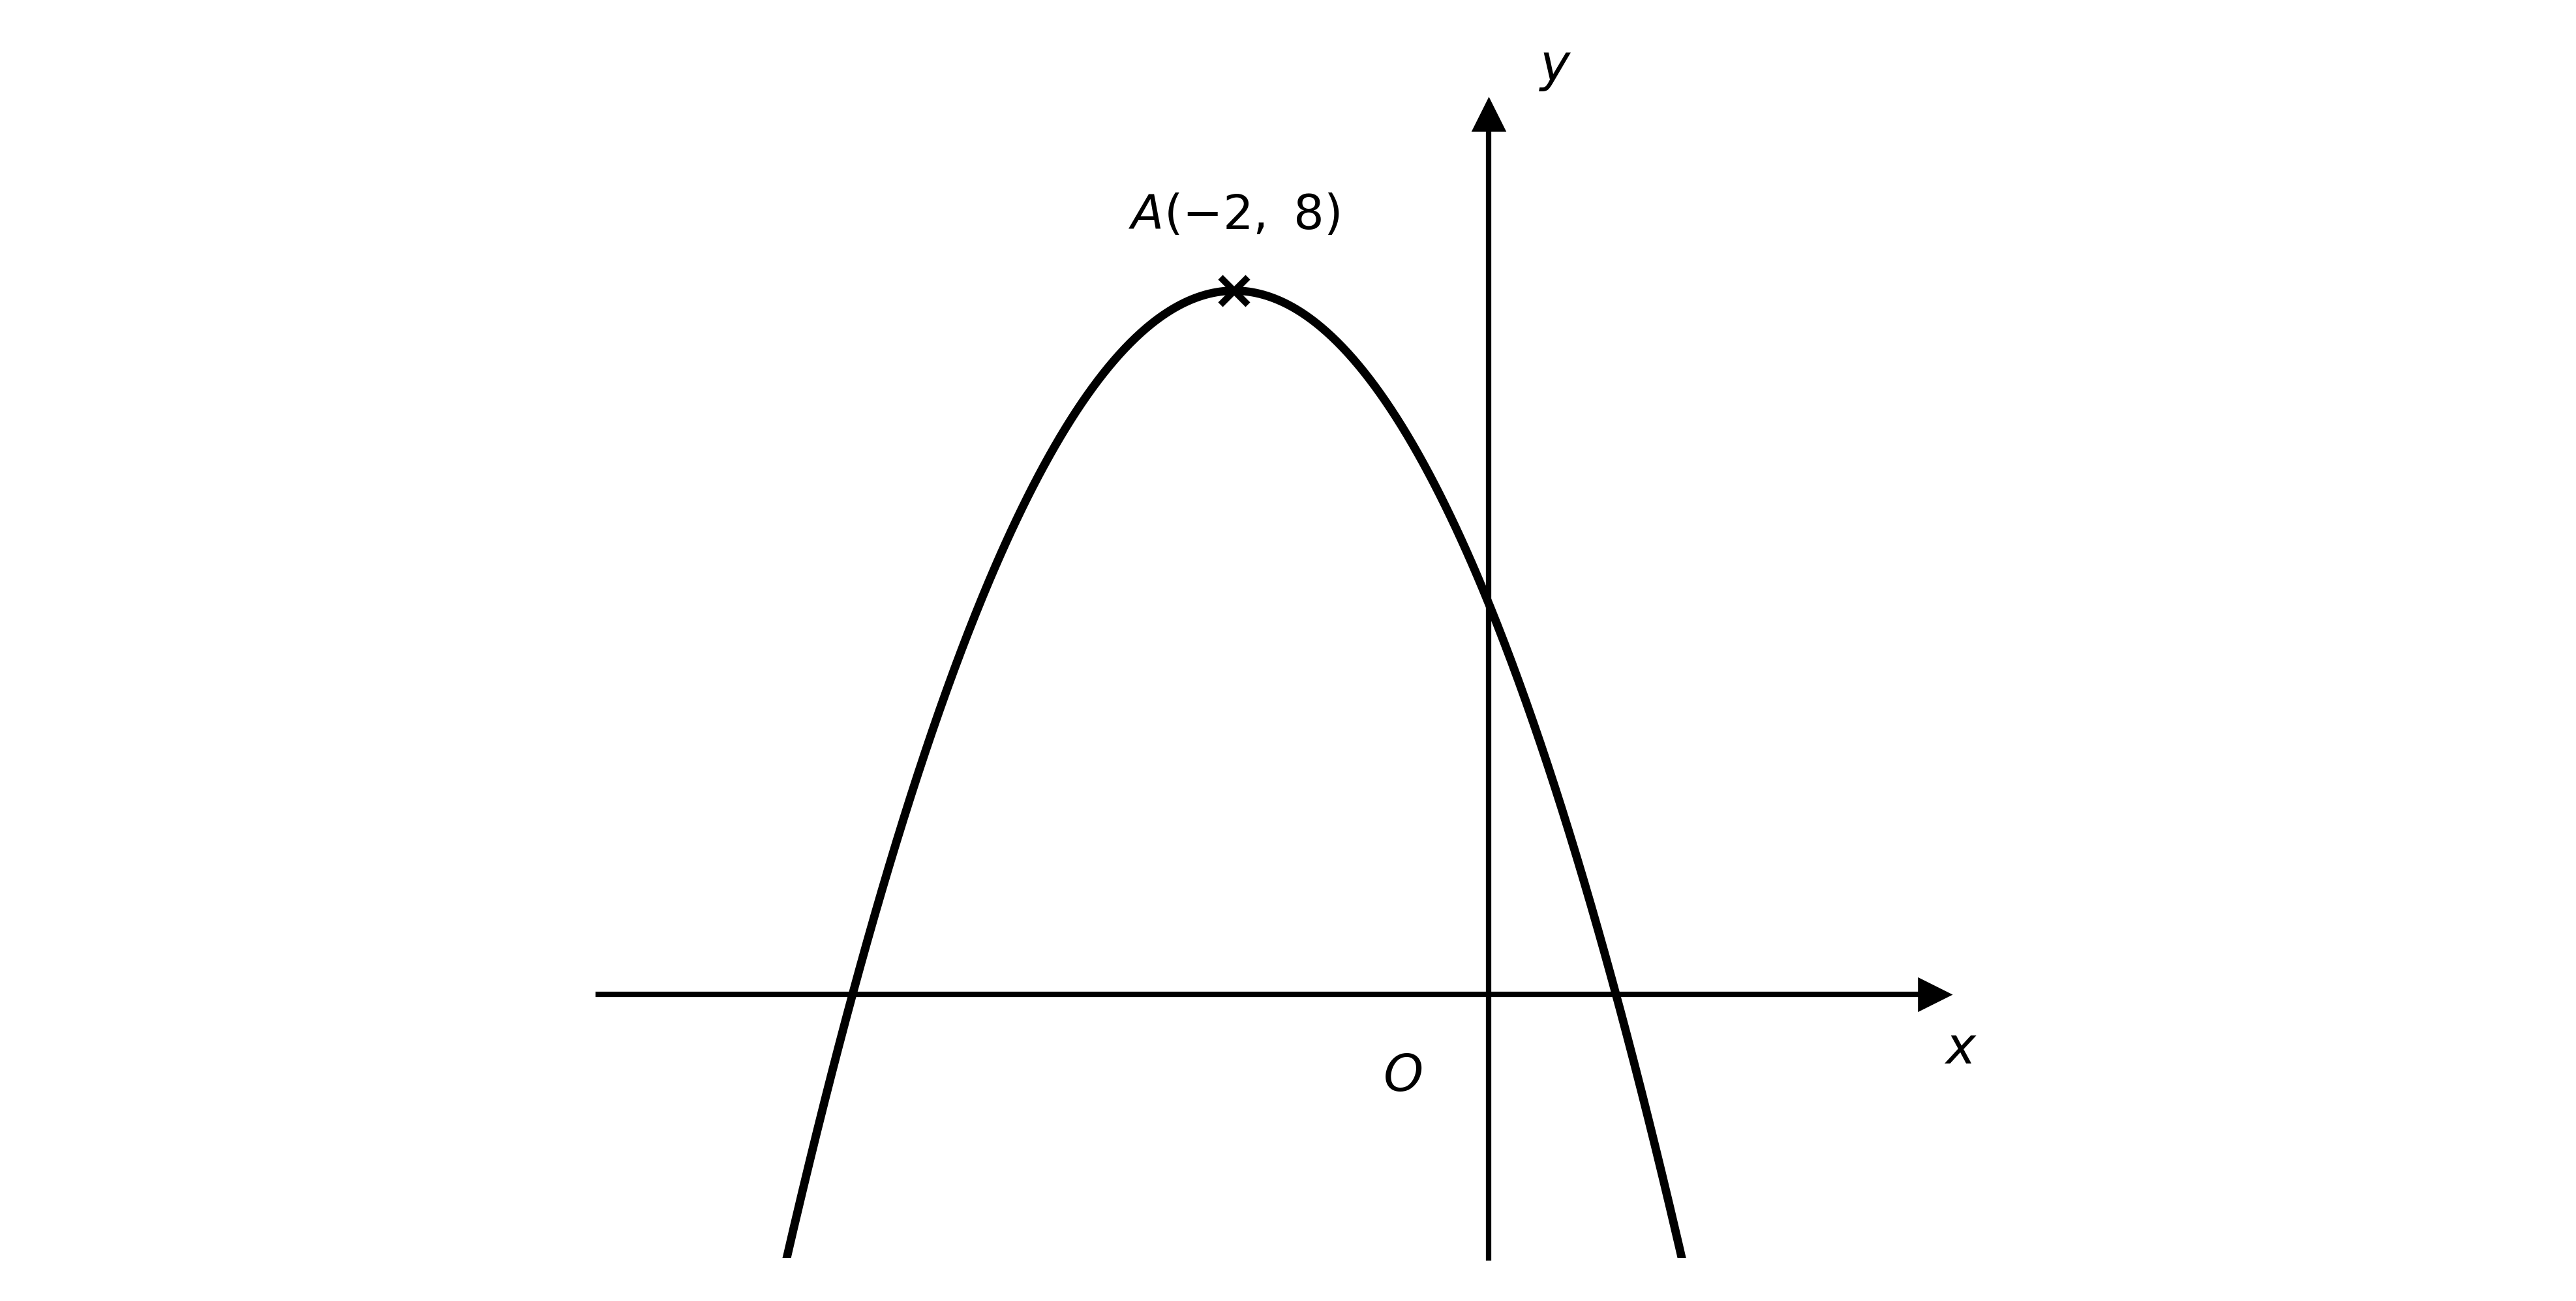
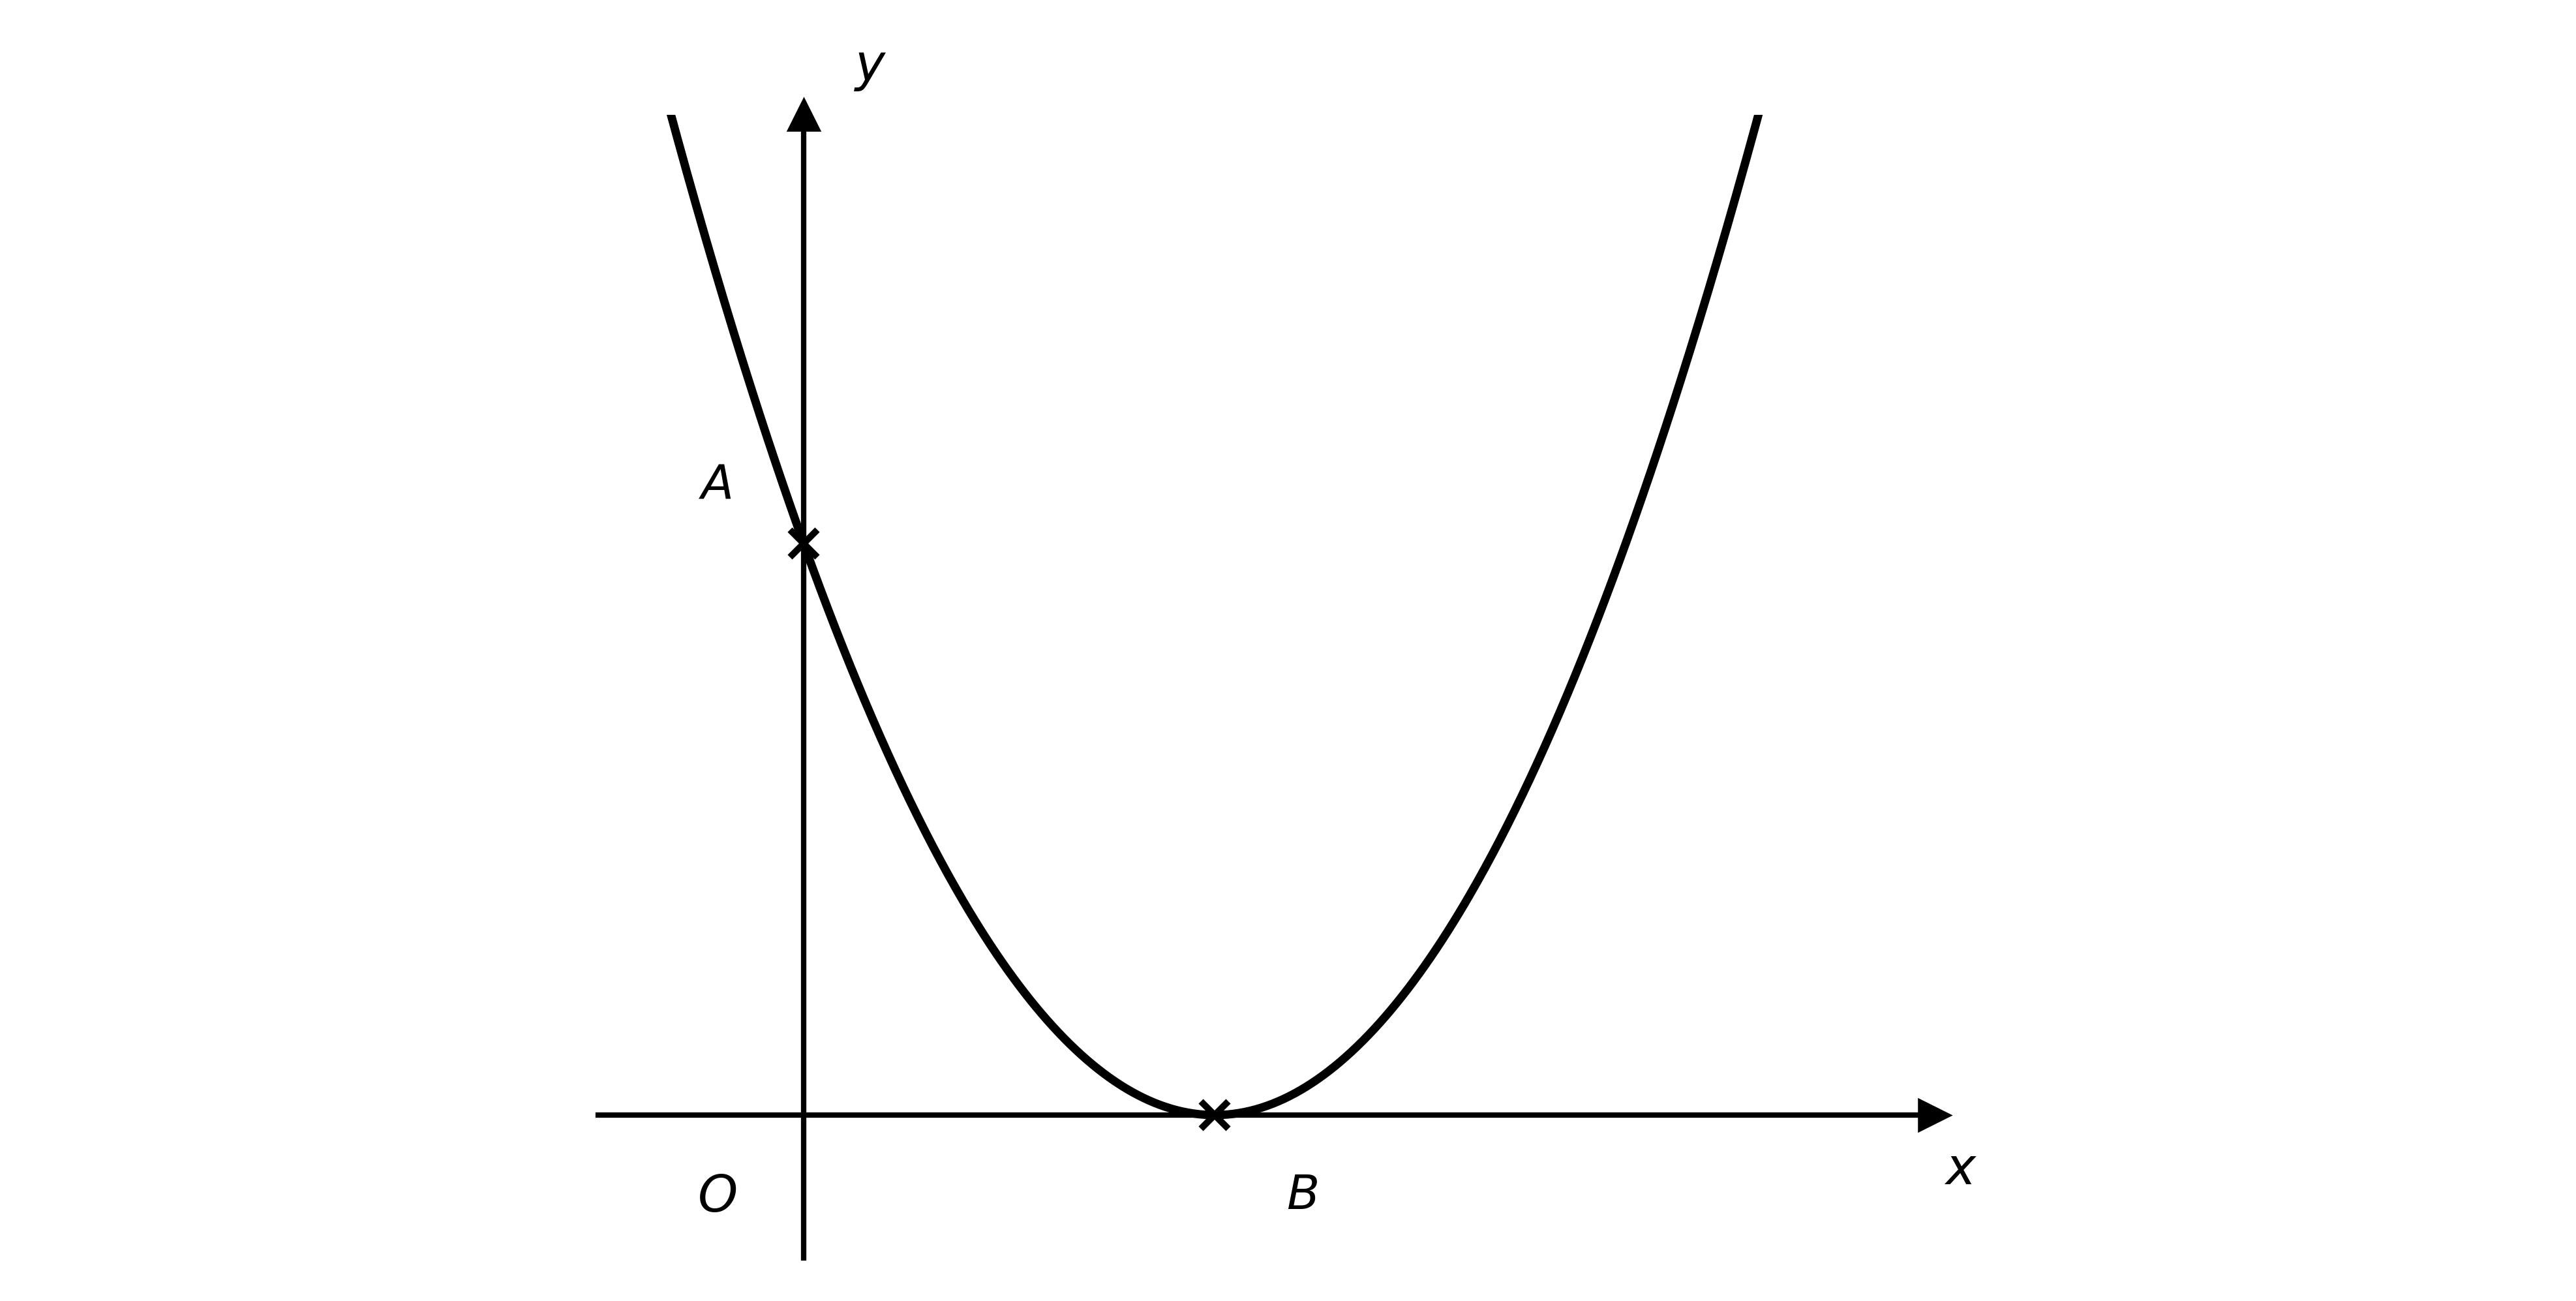
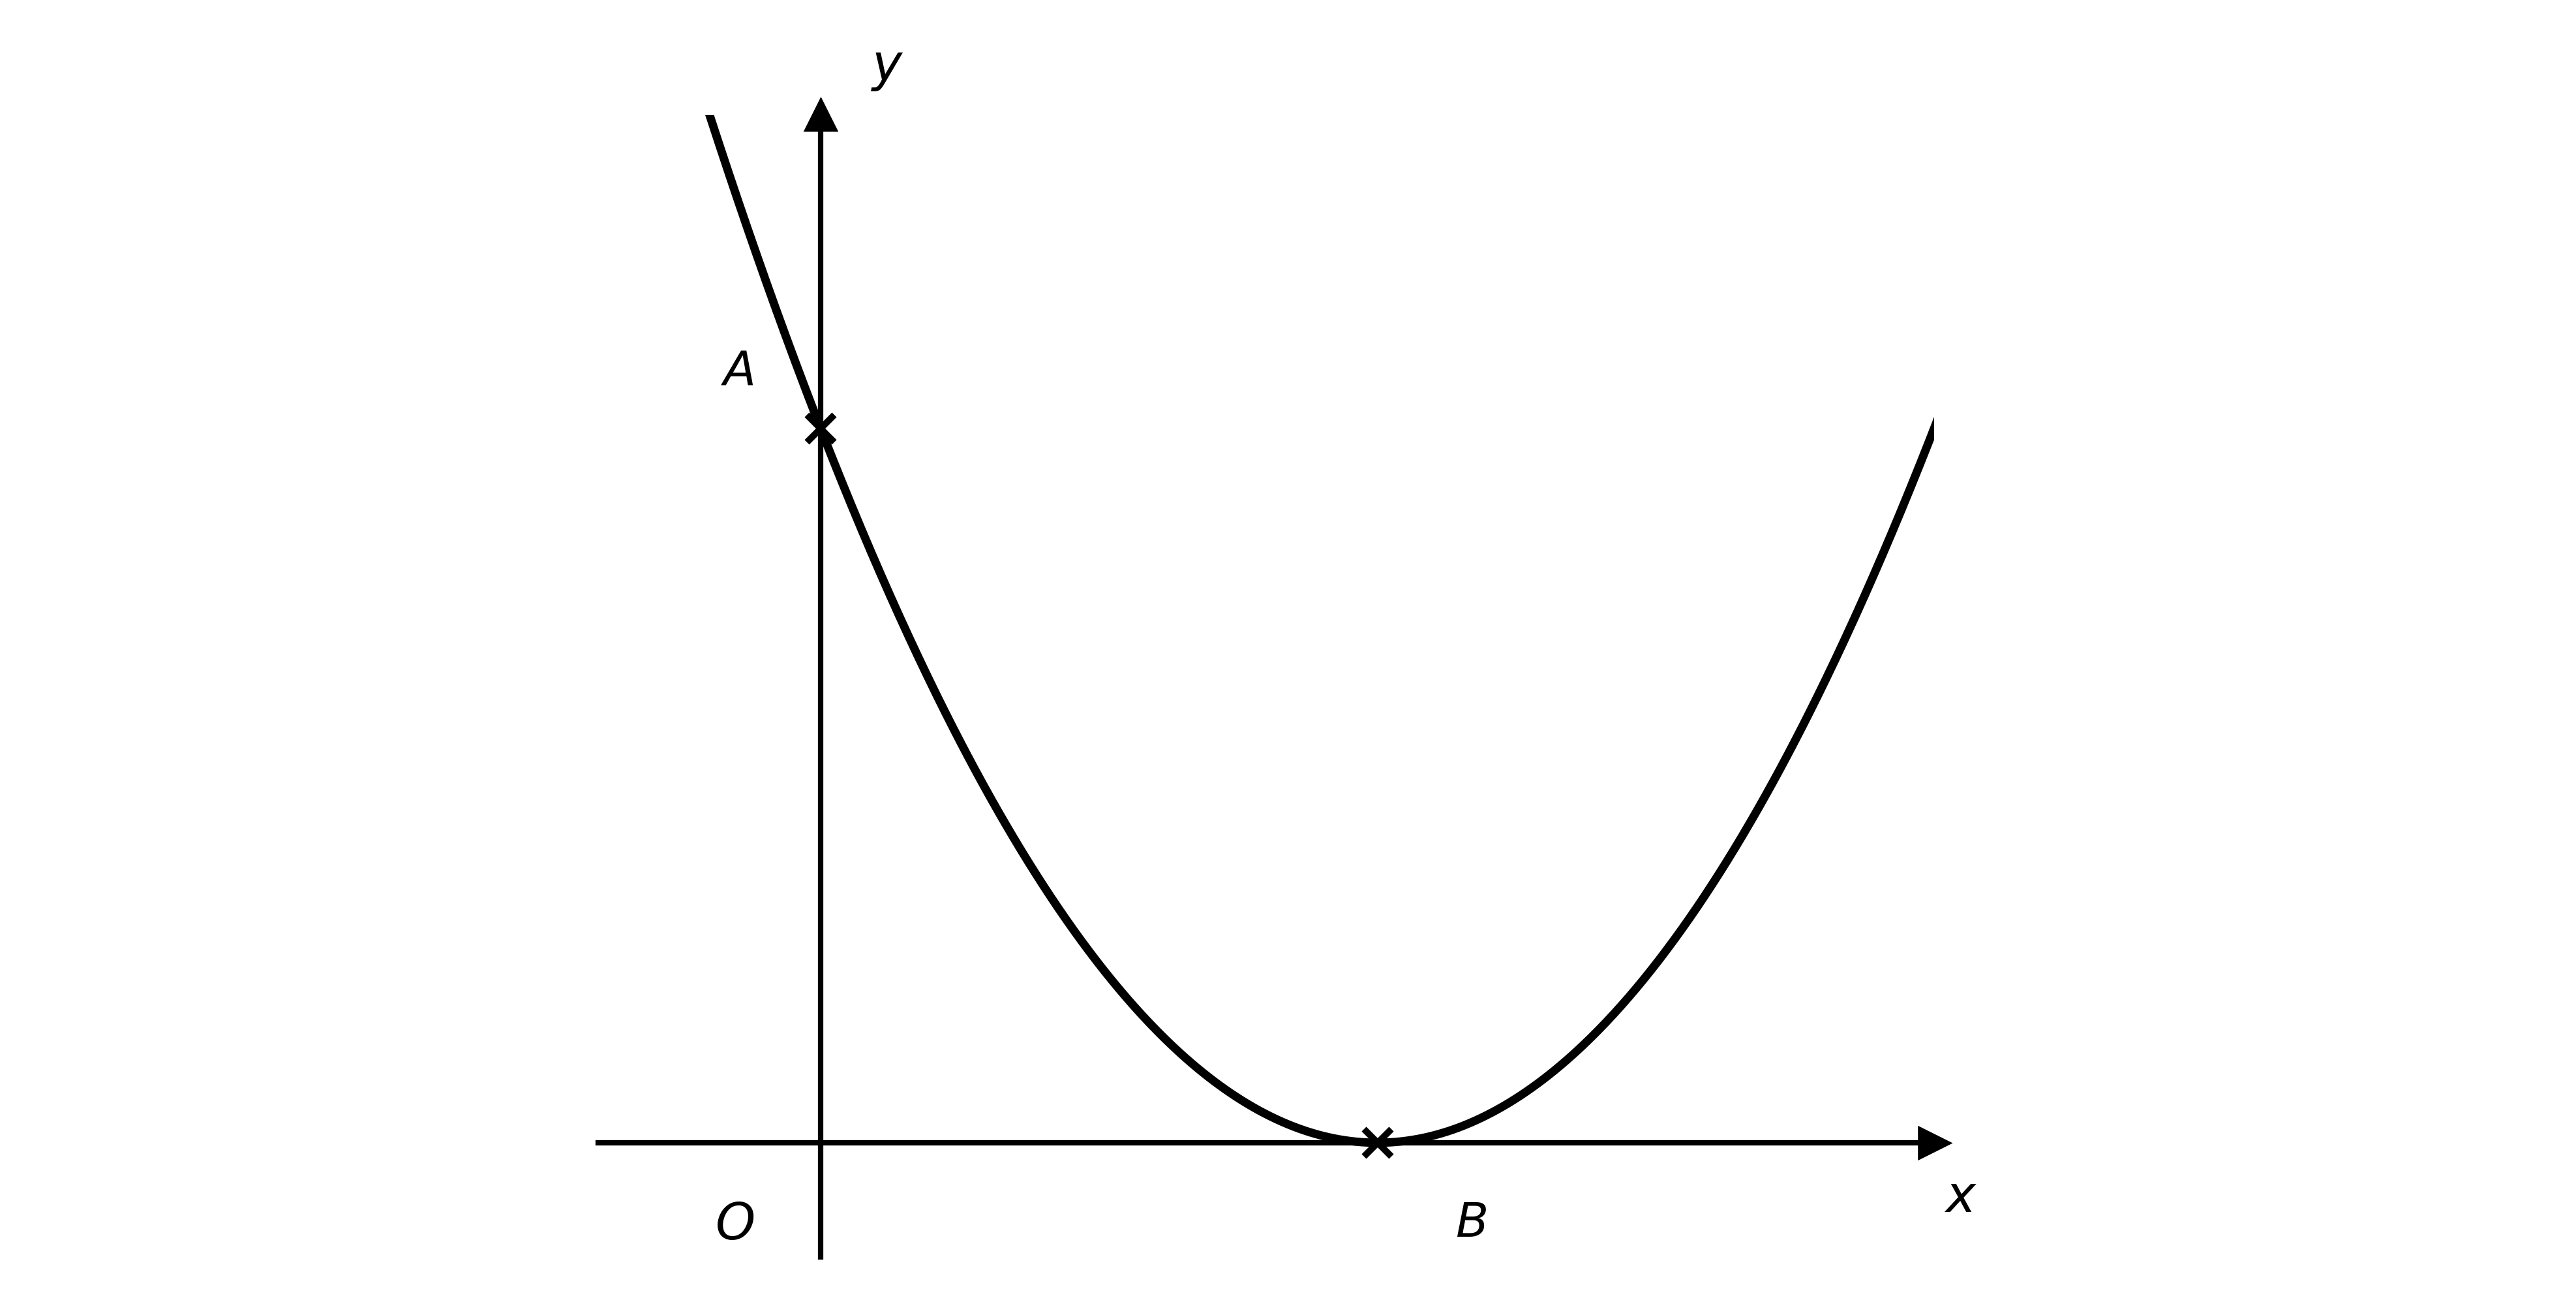
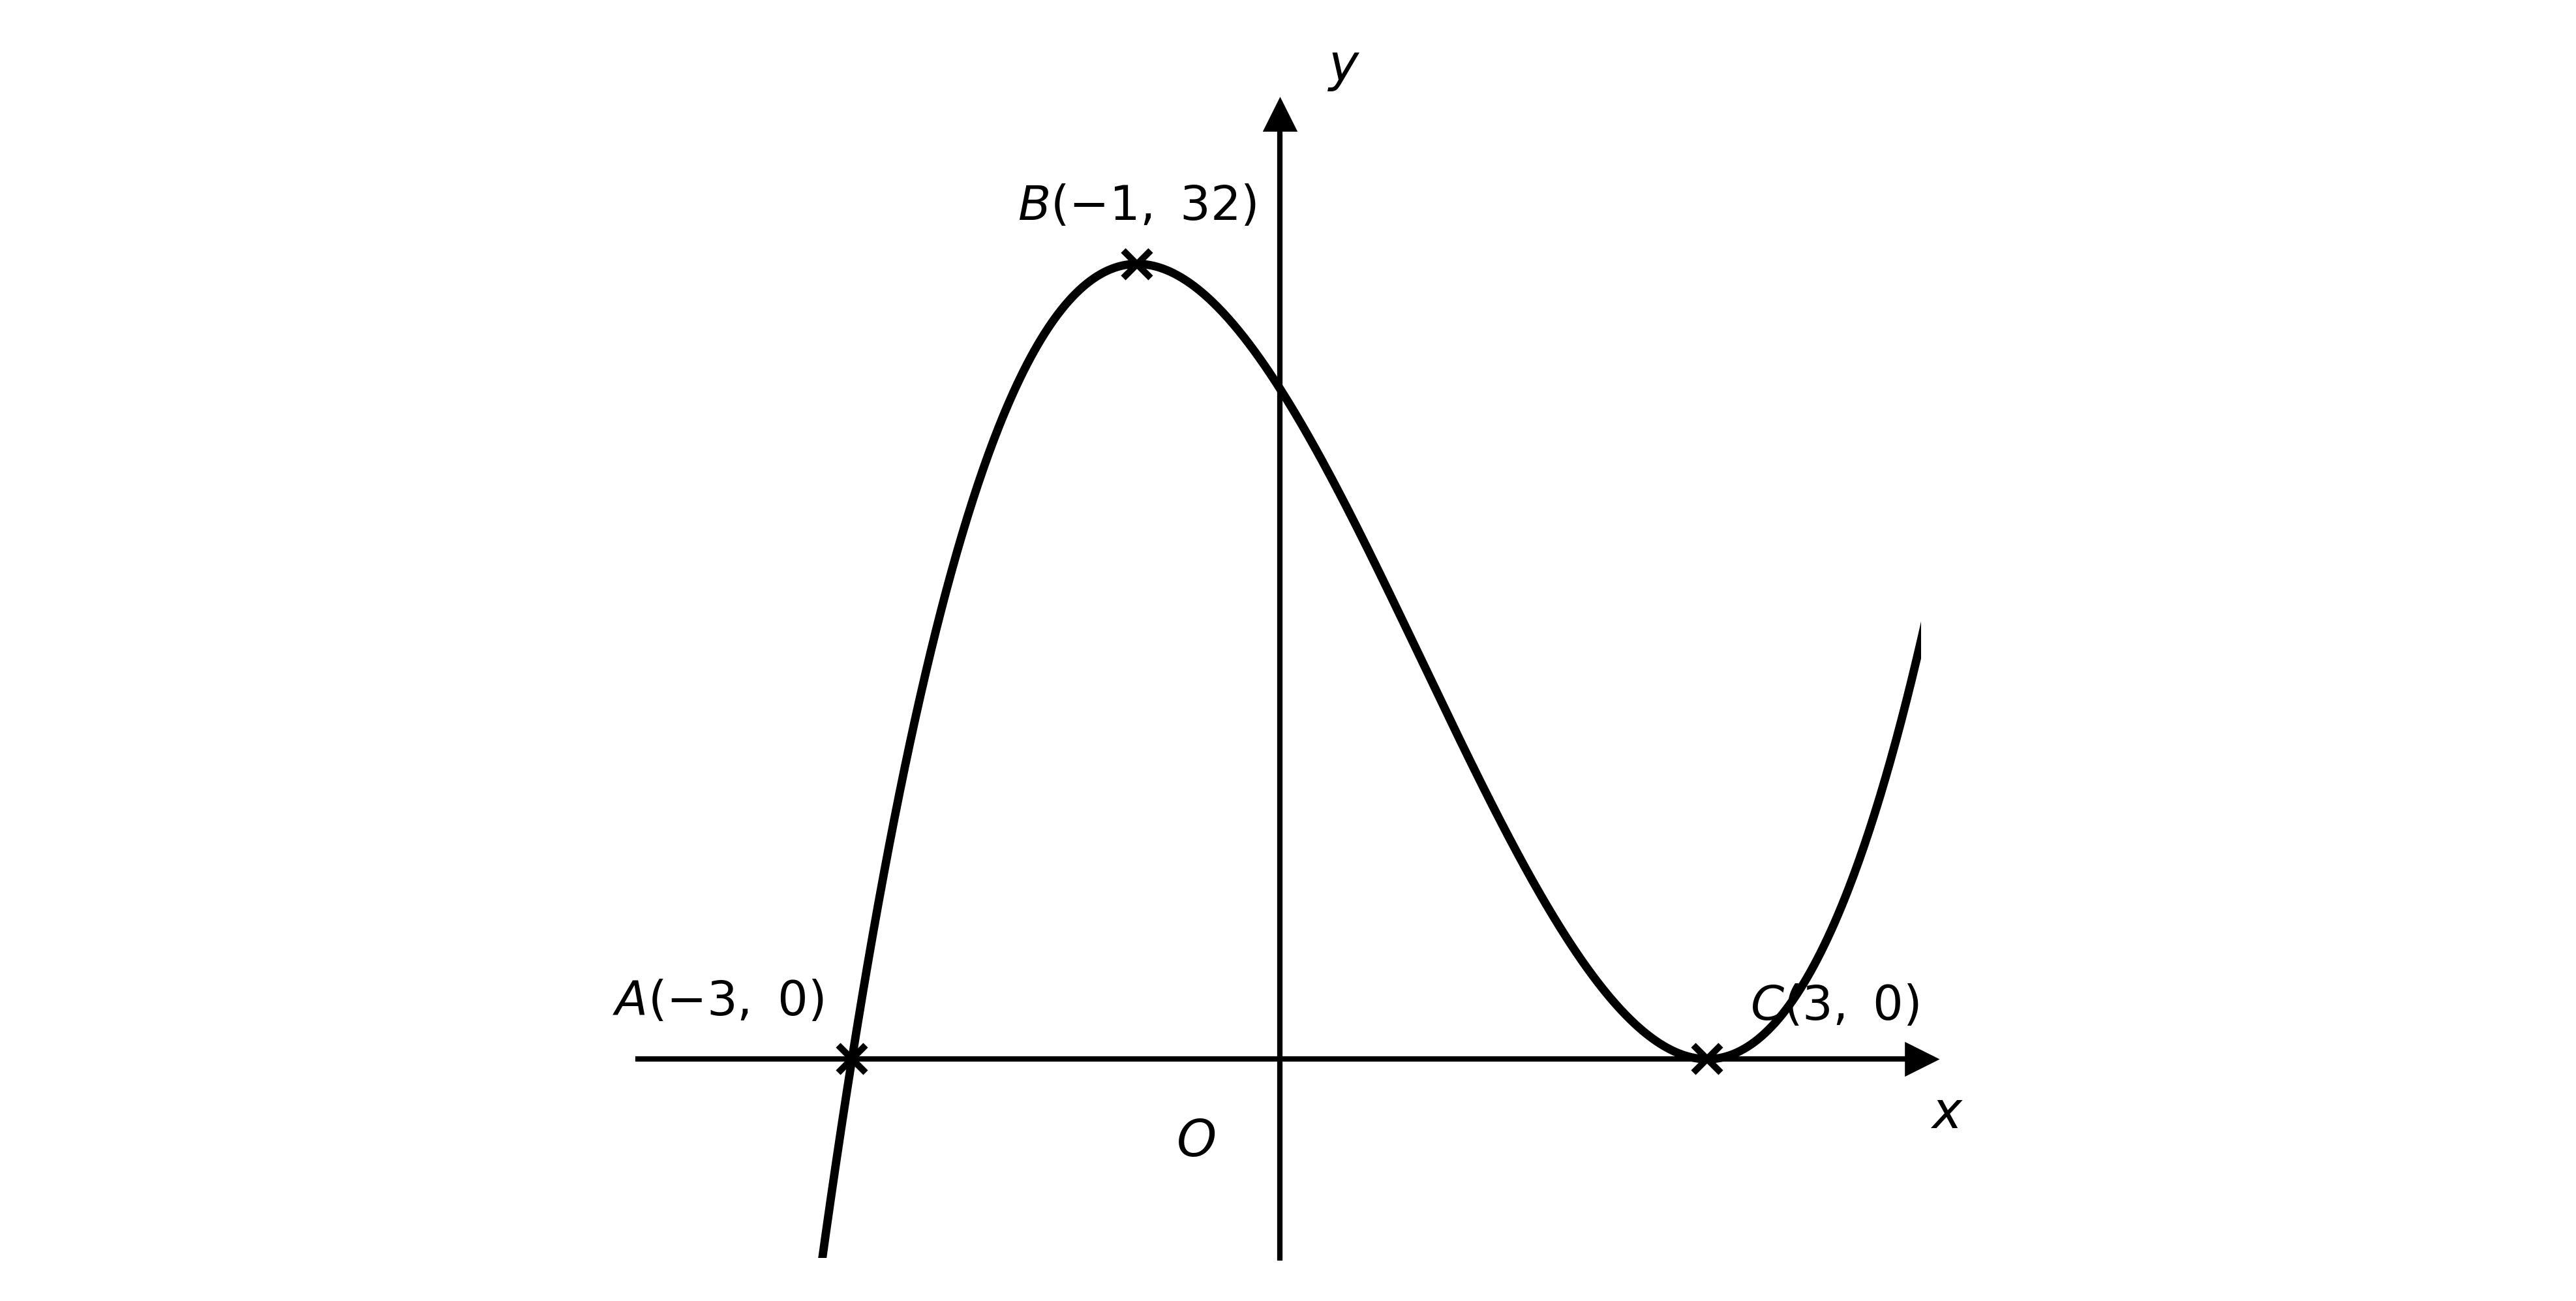
The diagram shows the graph of , where .

The graph meets the -axis at and touches the -axis at .
(i) Write down the coordinates of and .
(ii) The graph of is transformed to the graph of . Find the coordinates of the images of and under this transformation.
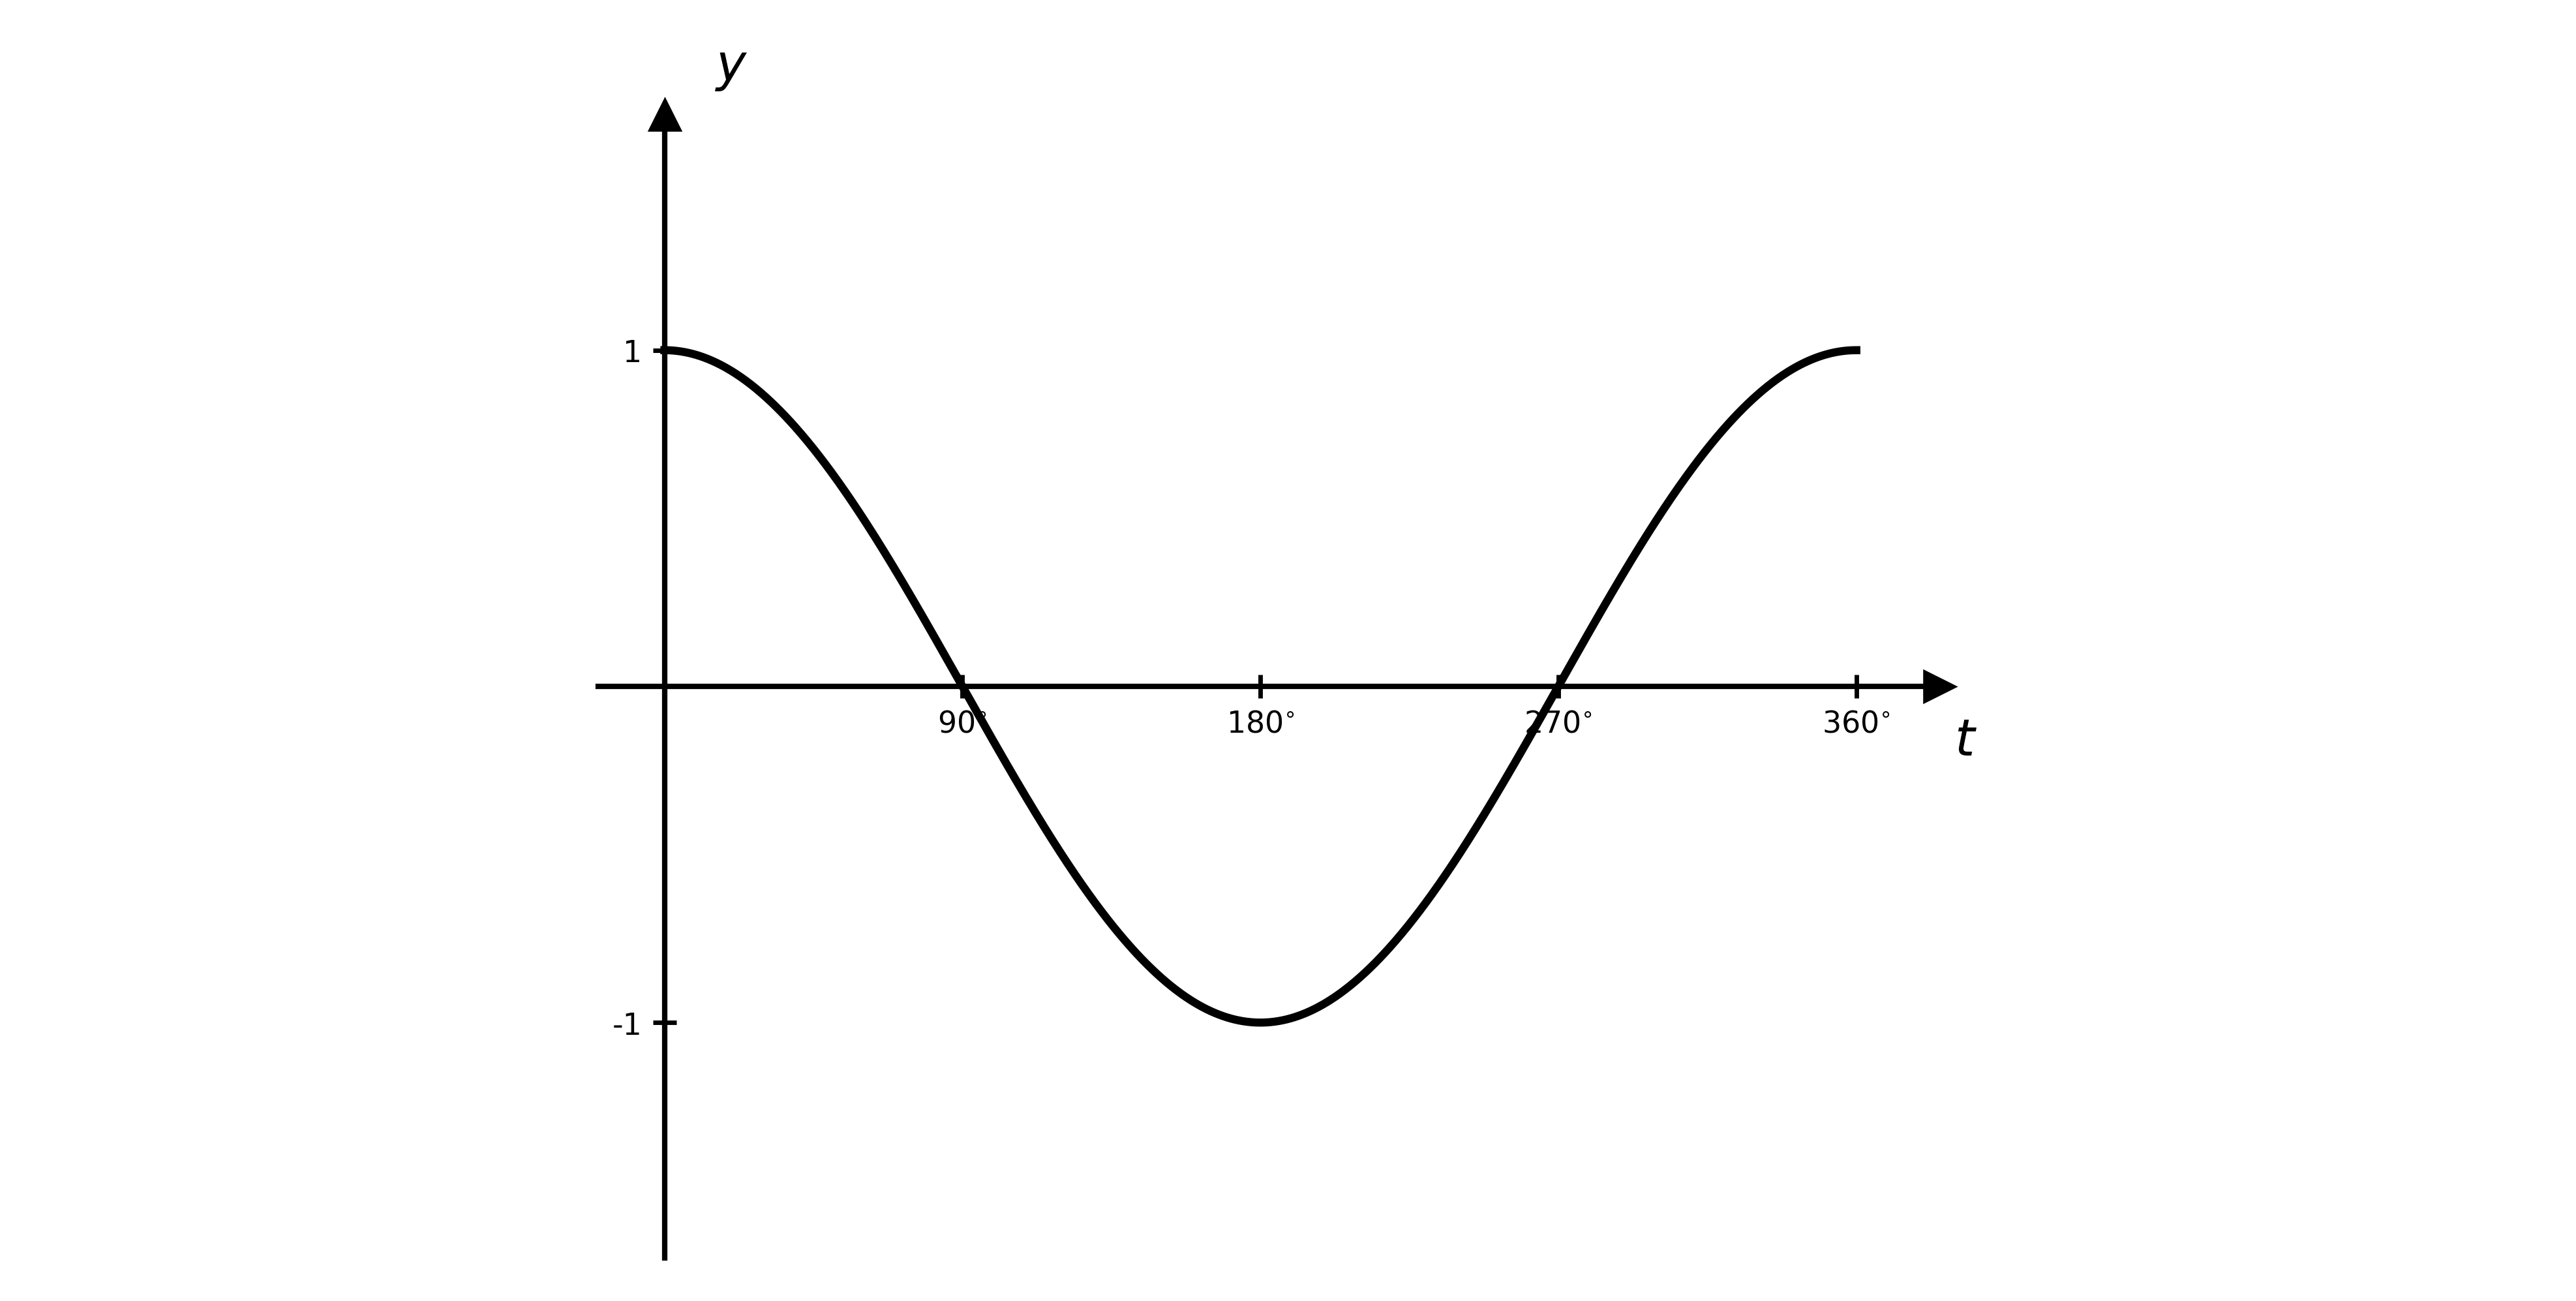
The diagram shows the graph of , where for .

(i) Write down the minimum value of in the given domain.
(ii) Write down the value of at which this minimum occurs.
(i) Write down the minimum value of in the given domain.
(ii) Write down the value of at which this minimum occurs.
Describe the combination of transformations that maps the graph of onto the graph of for .
The graph of is transformed by the following sequence of transformations, applied in this order.
\begin{pmatrix} 0 \\ -2 \end{pmatrix}Write down, in terms of , the equation of the resulting graph.
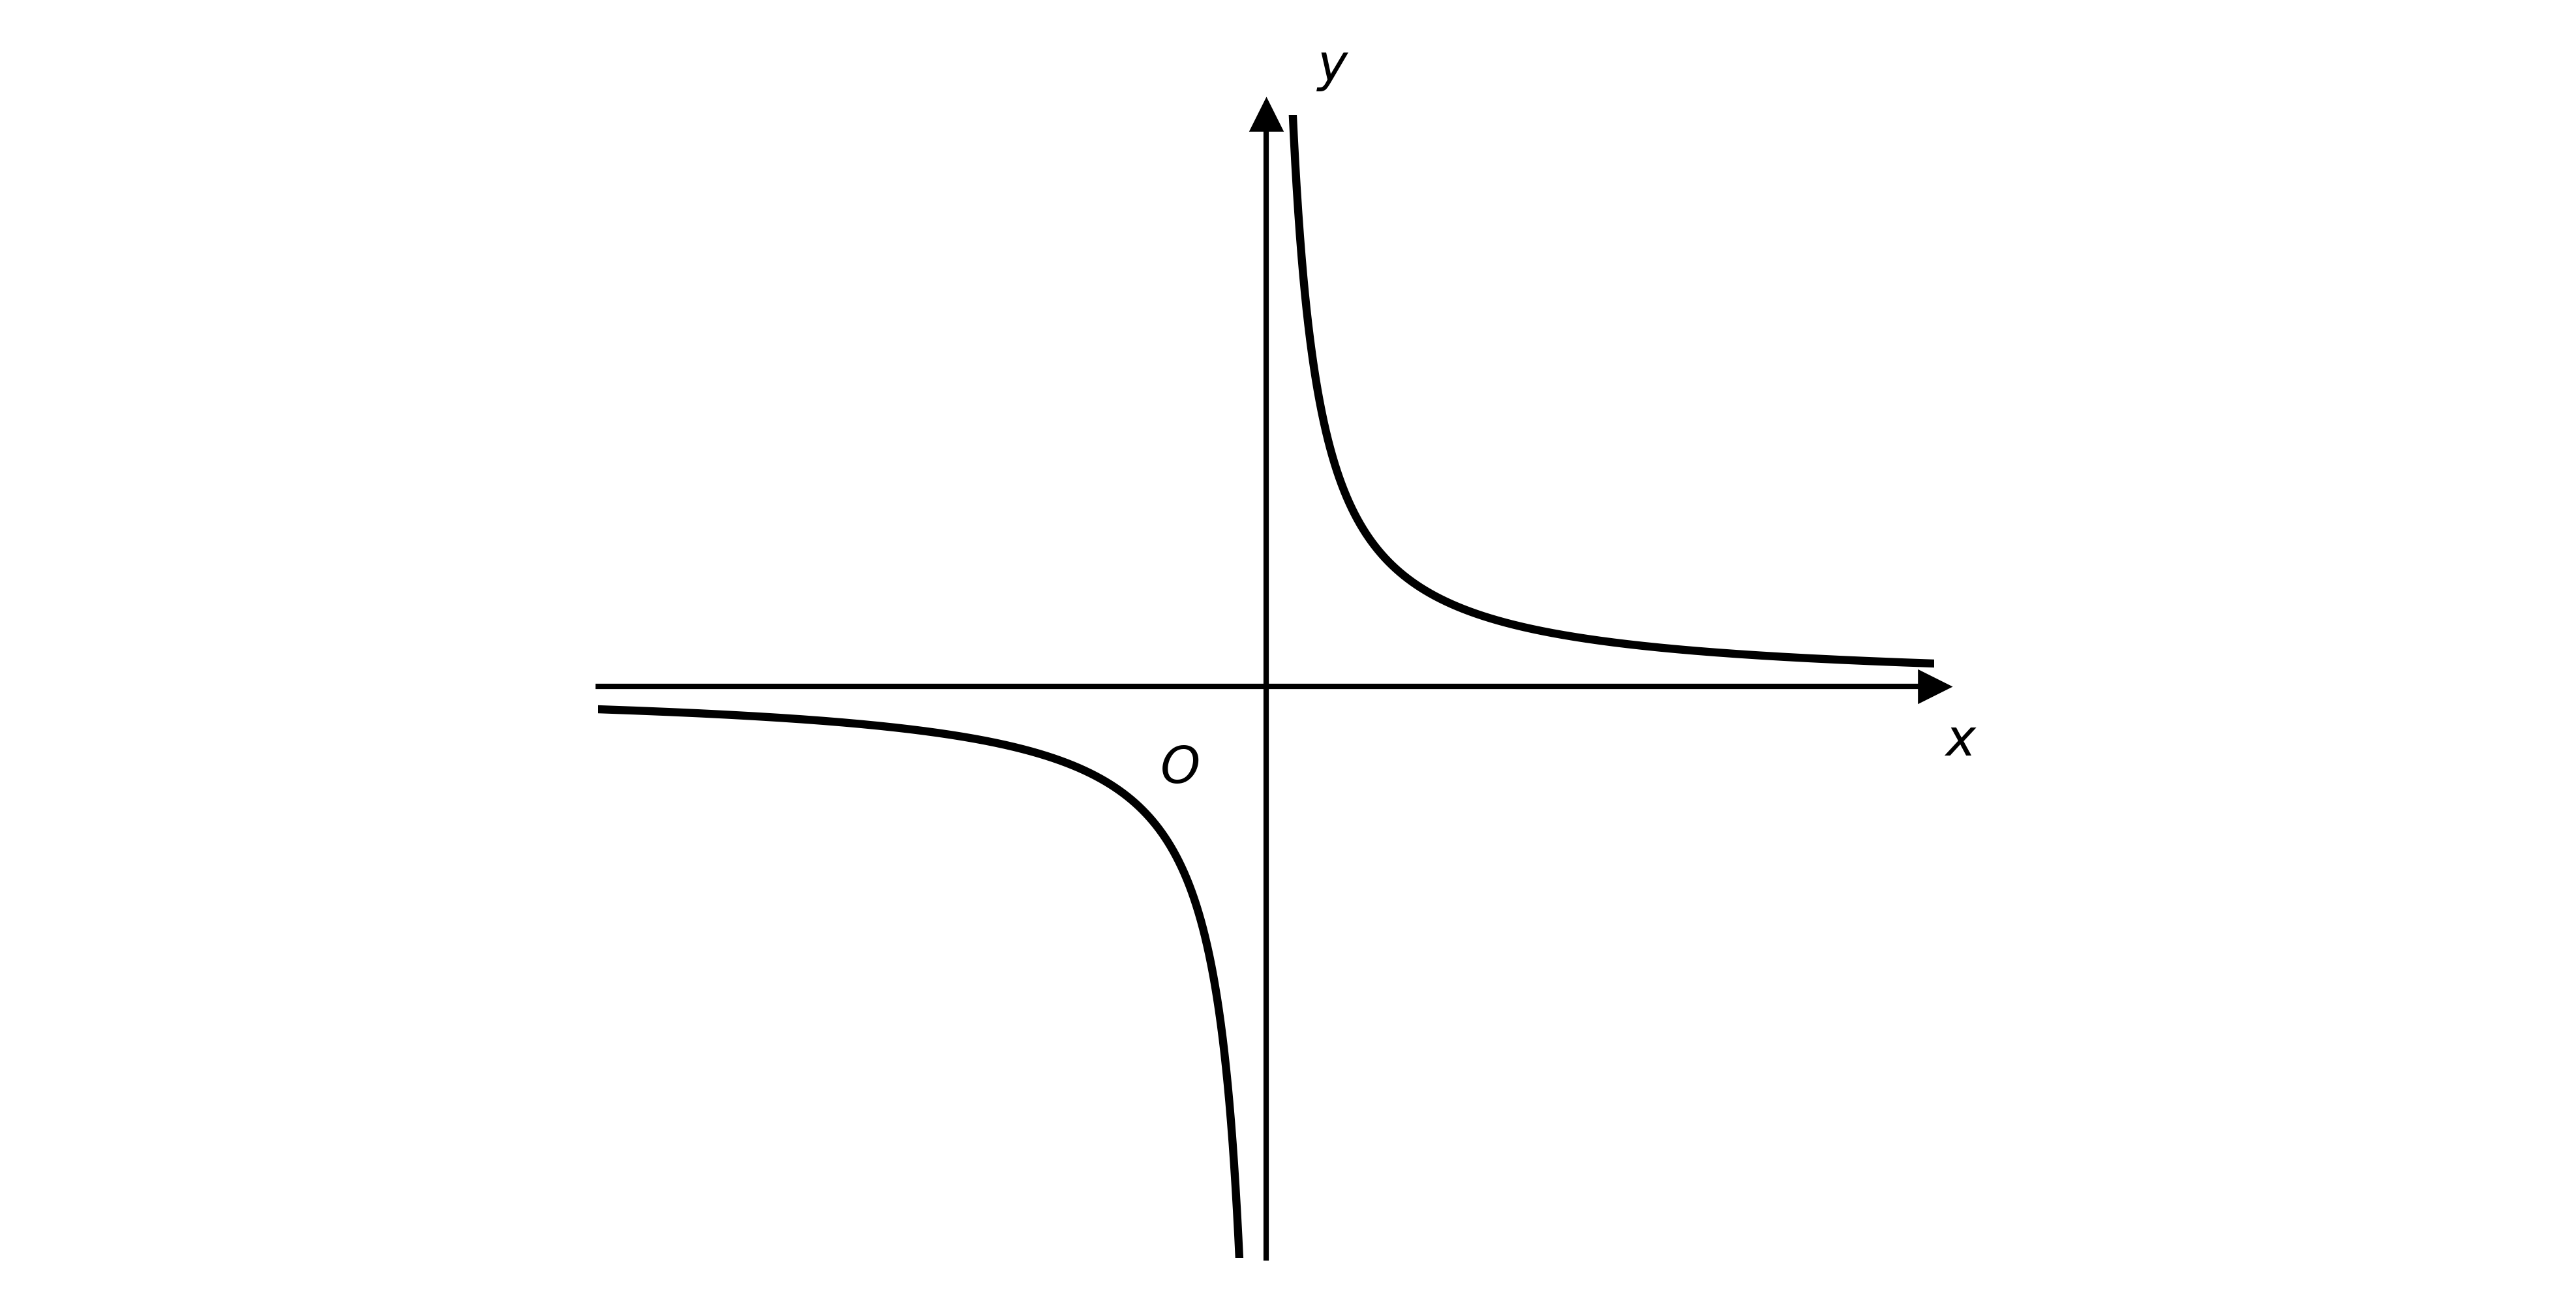
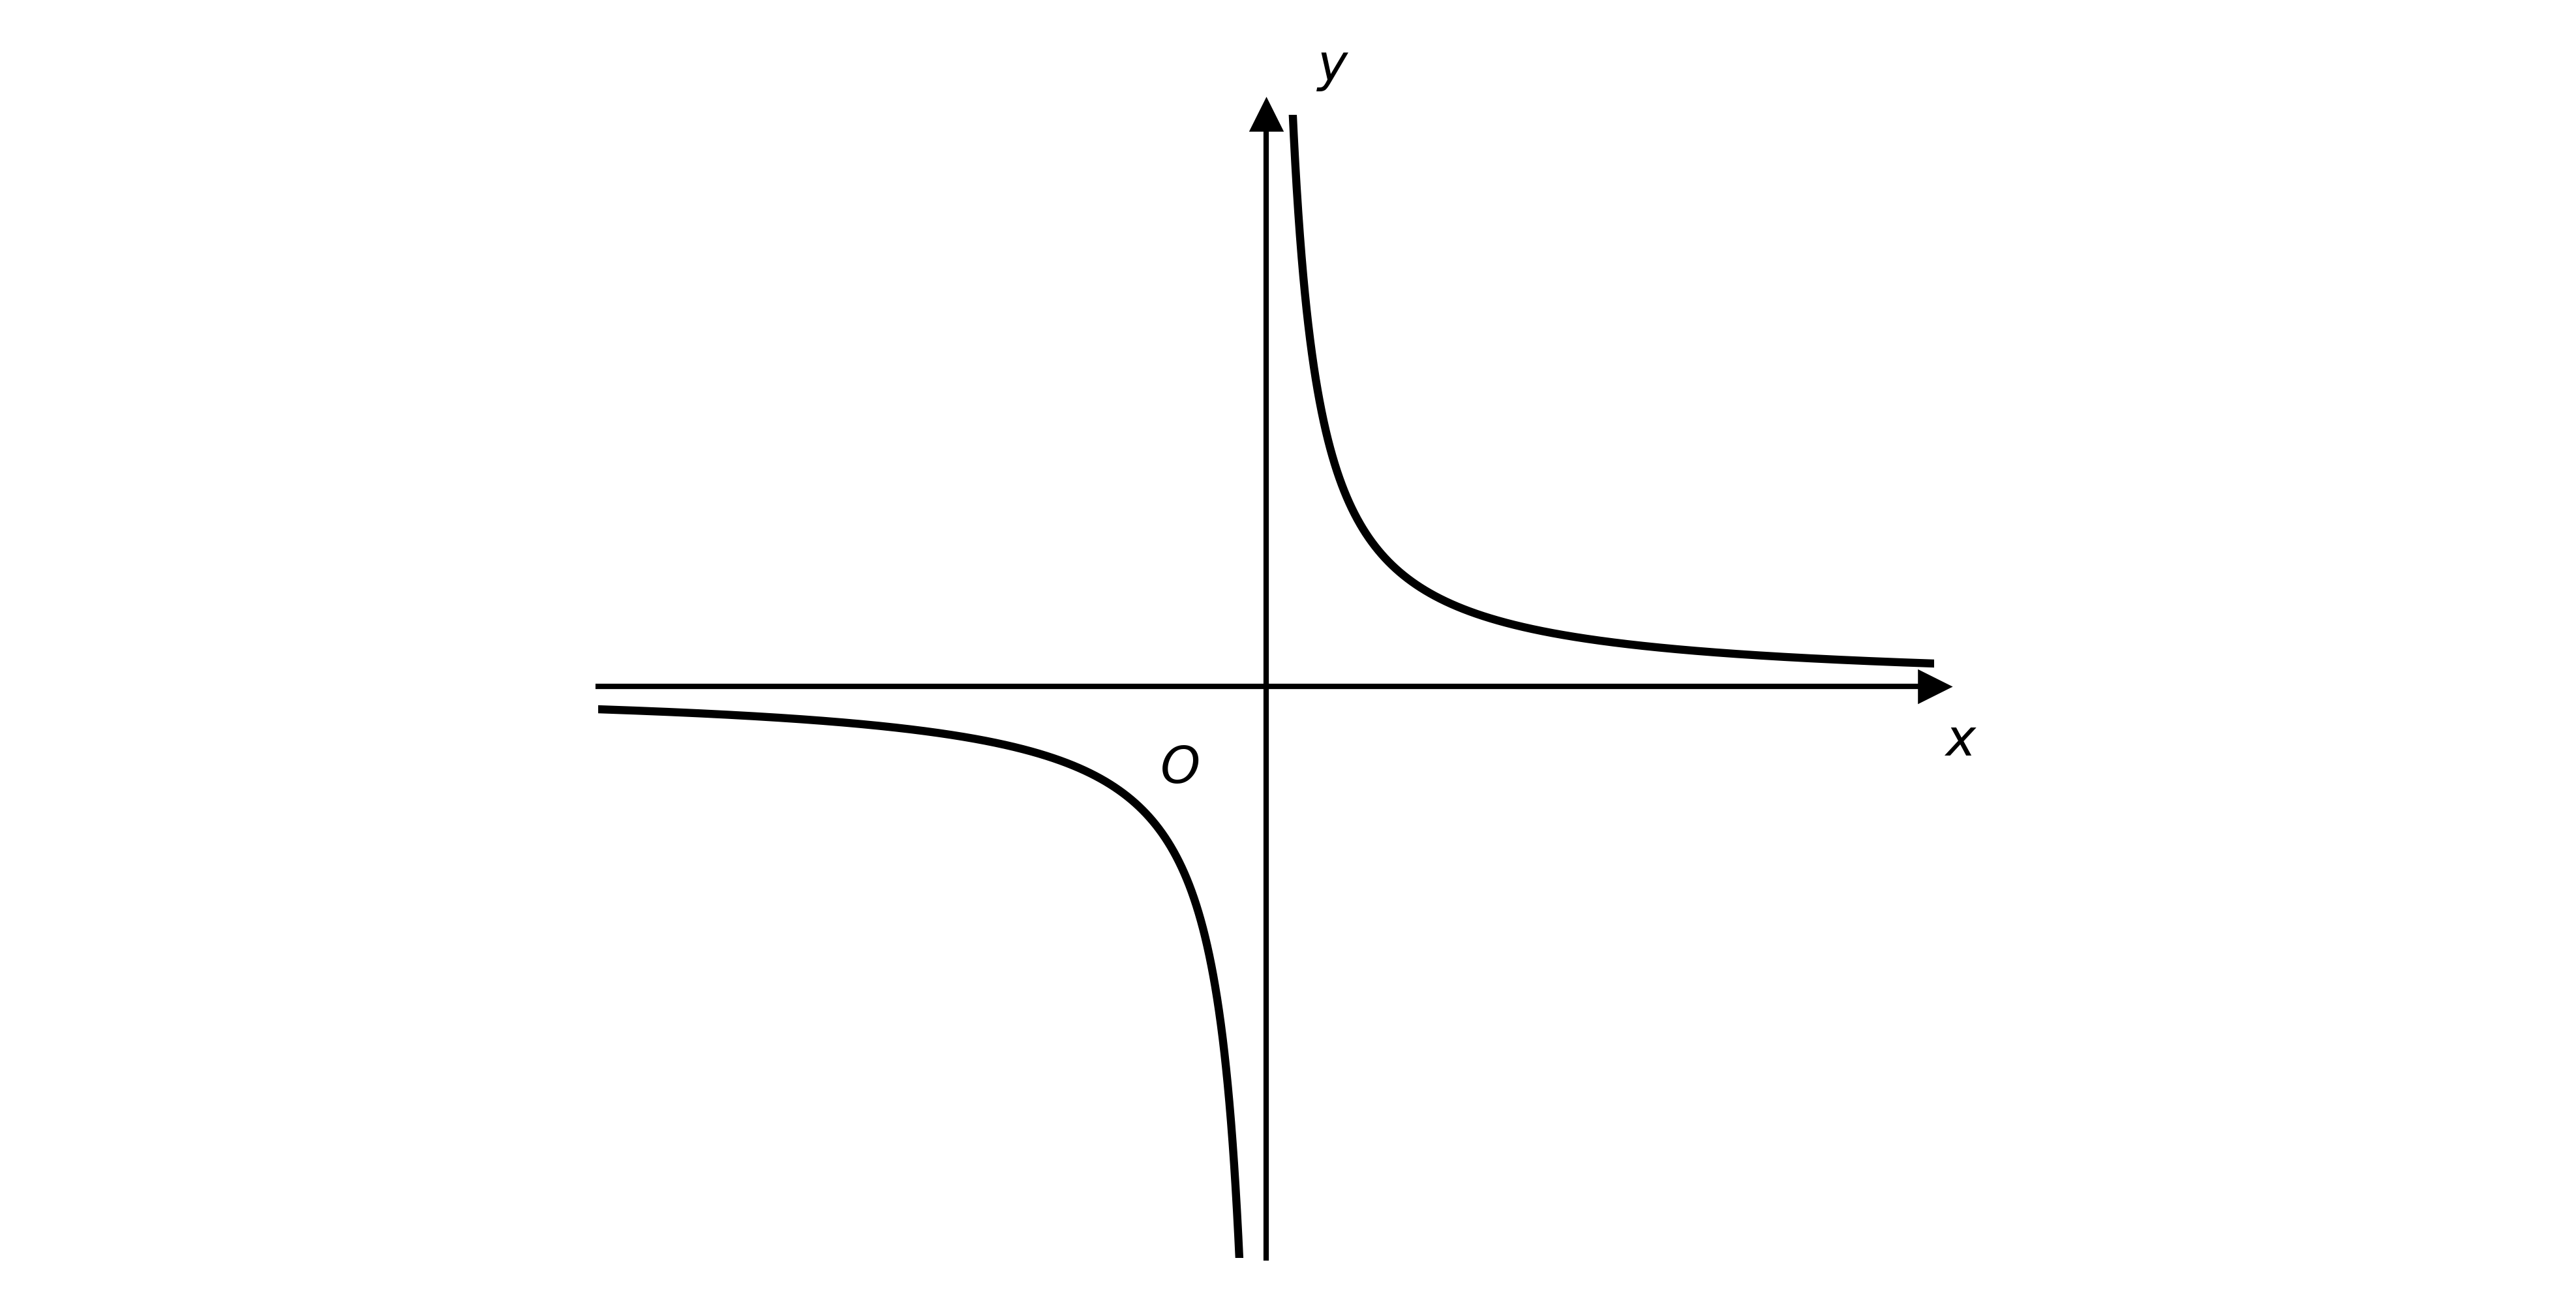
The diagram shows the graph of , where , .

(i) Write down the equations of the two asymptotes of .
(ii) Determine the equations of the two asymptotes of the graph of .
Describe fully, in order, the sequence of transformations that maps the graph of onto each of the following graphs.
(i)
(ii)
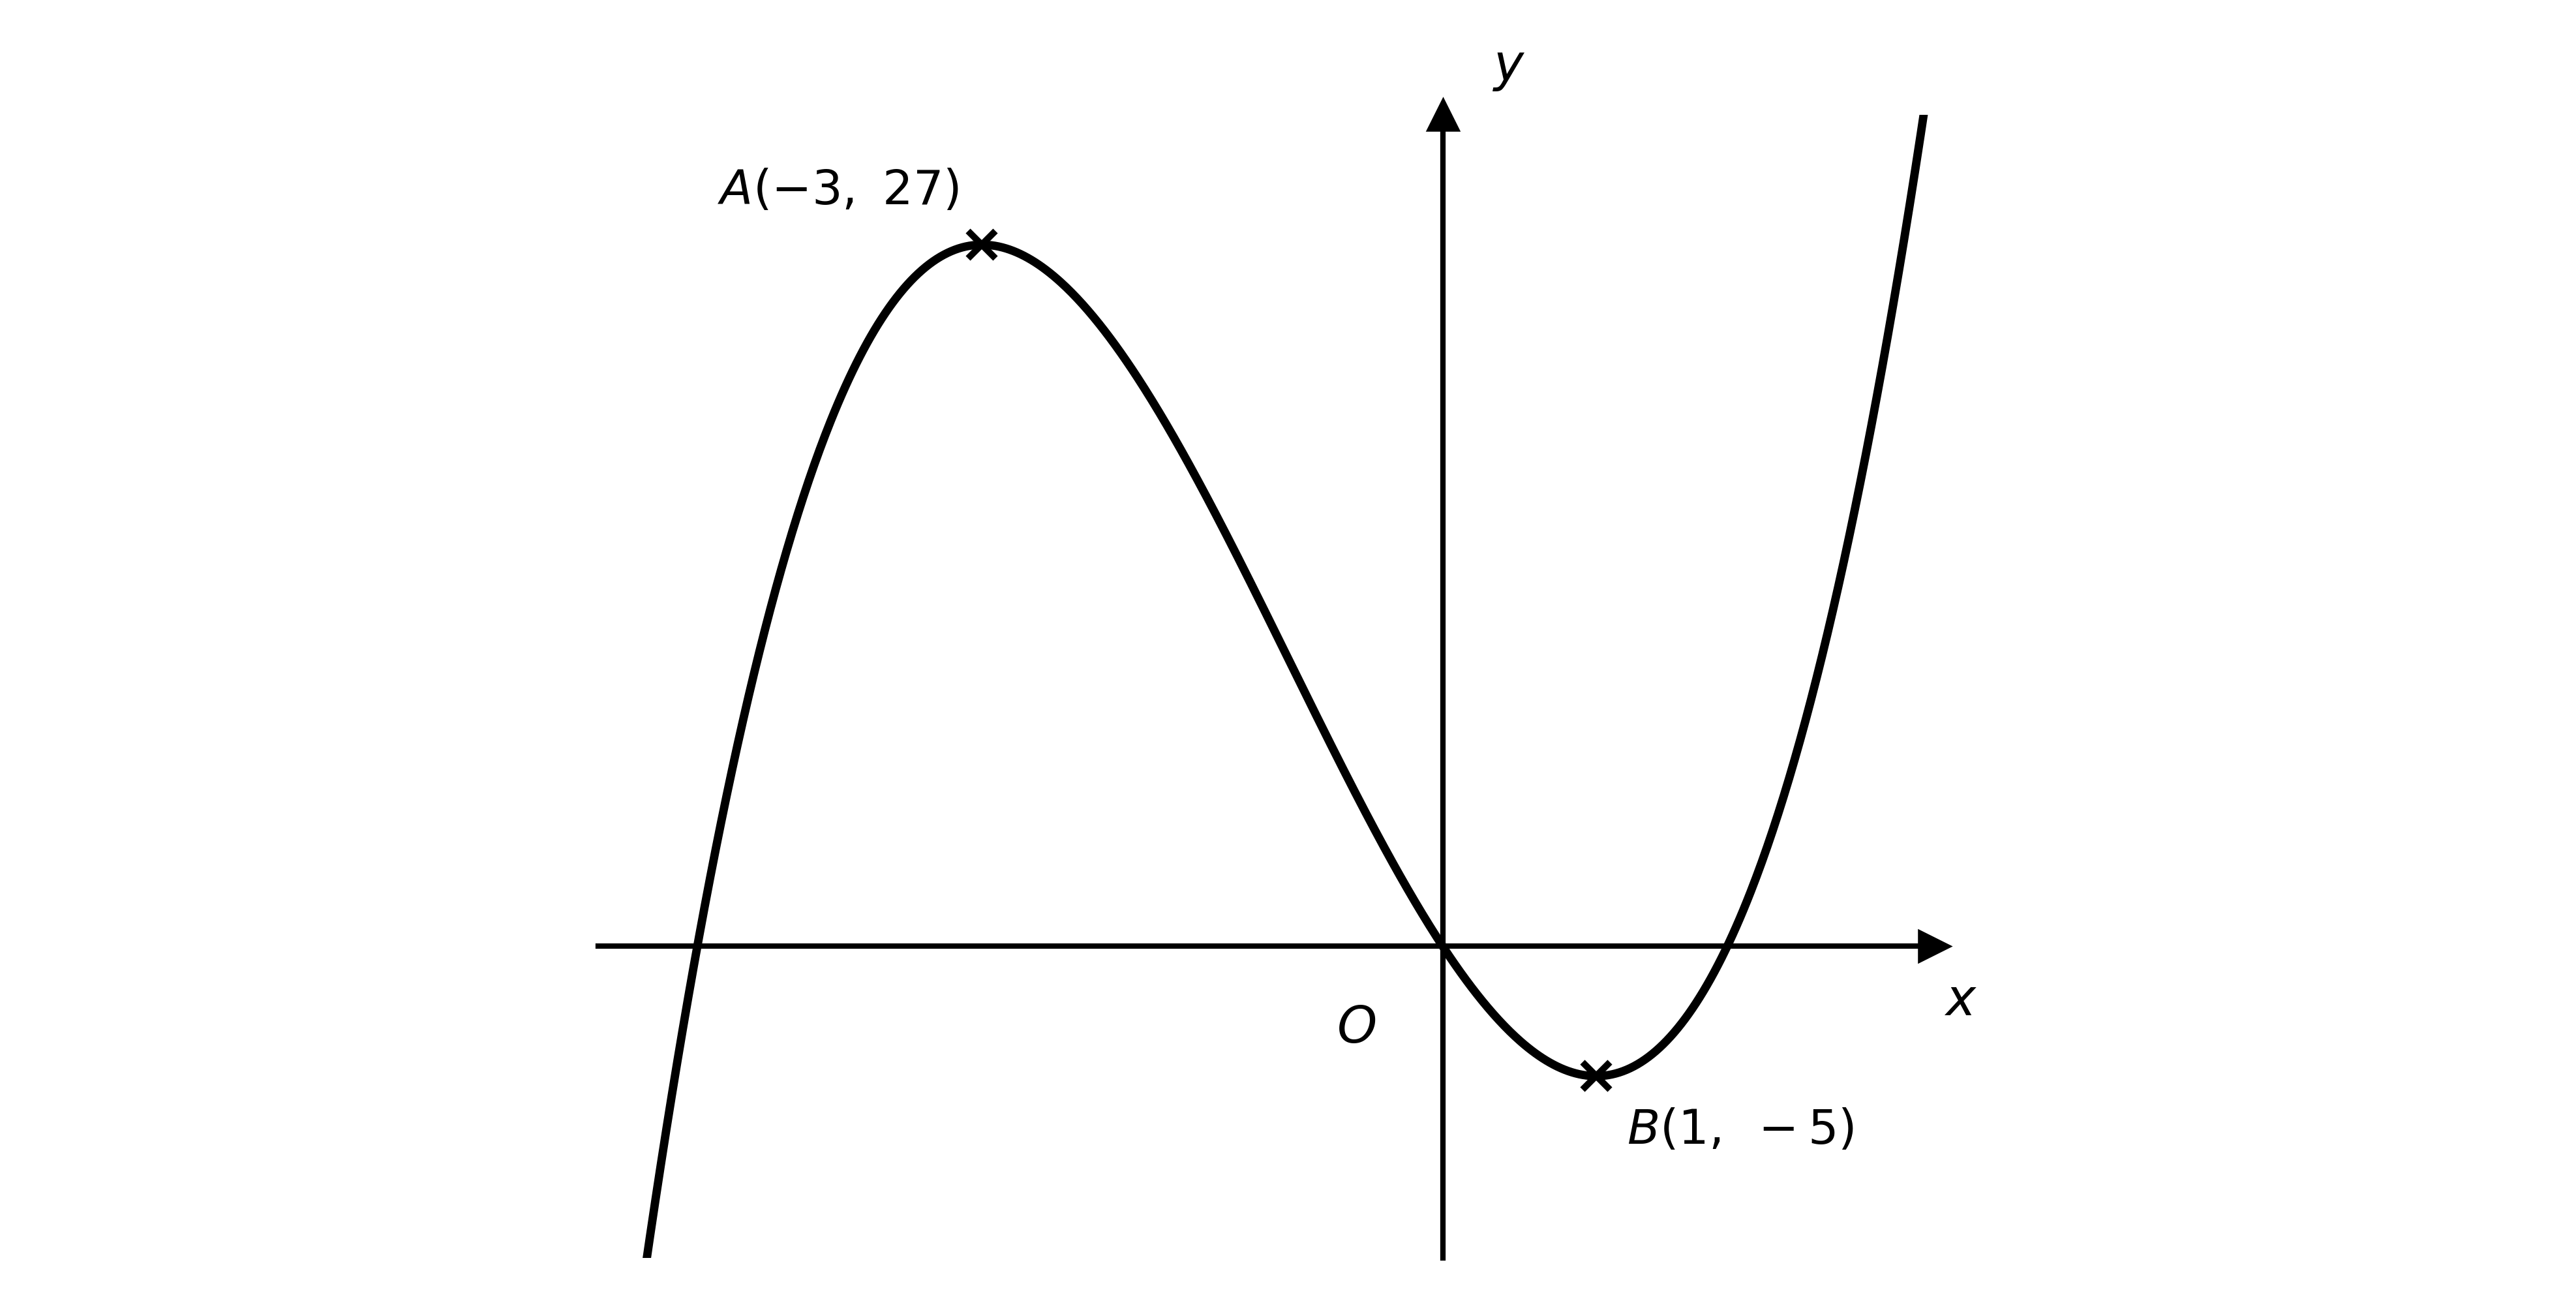
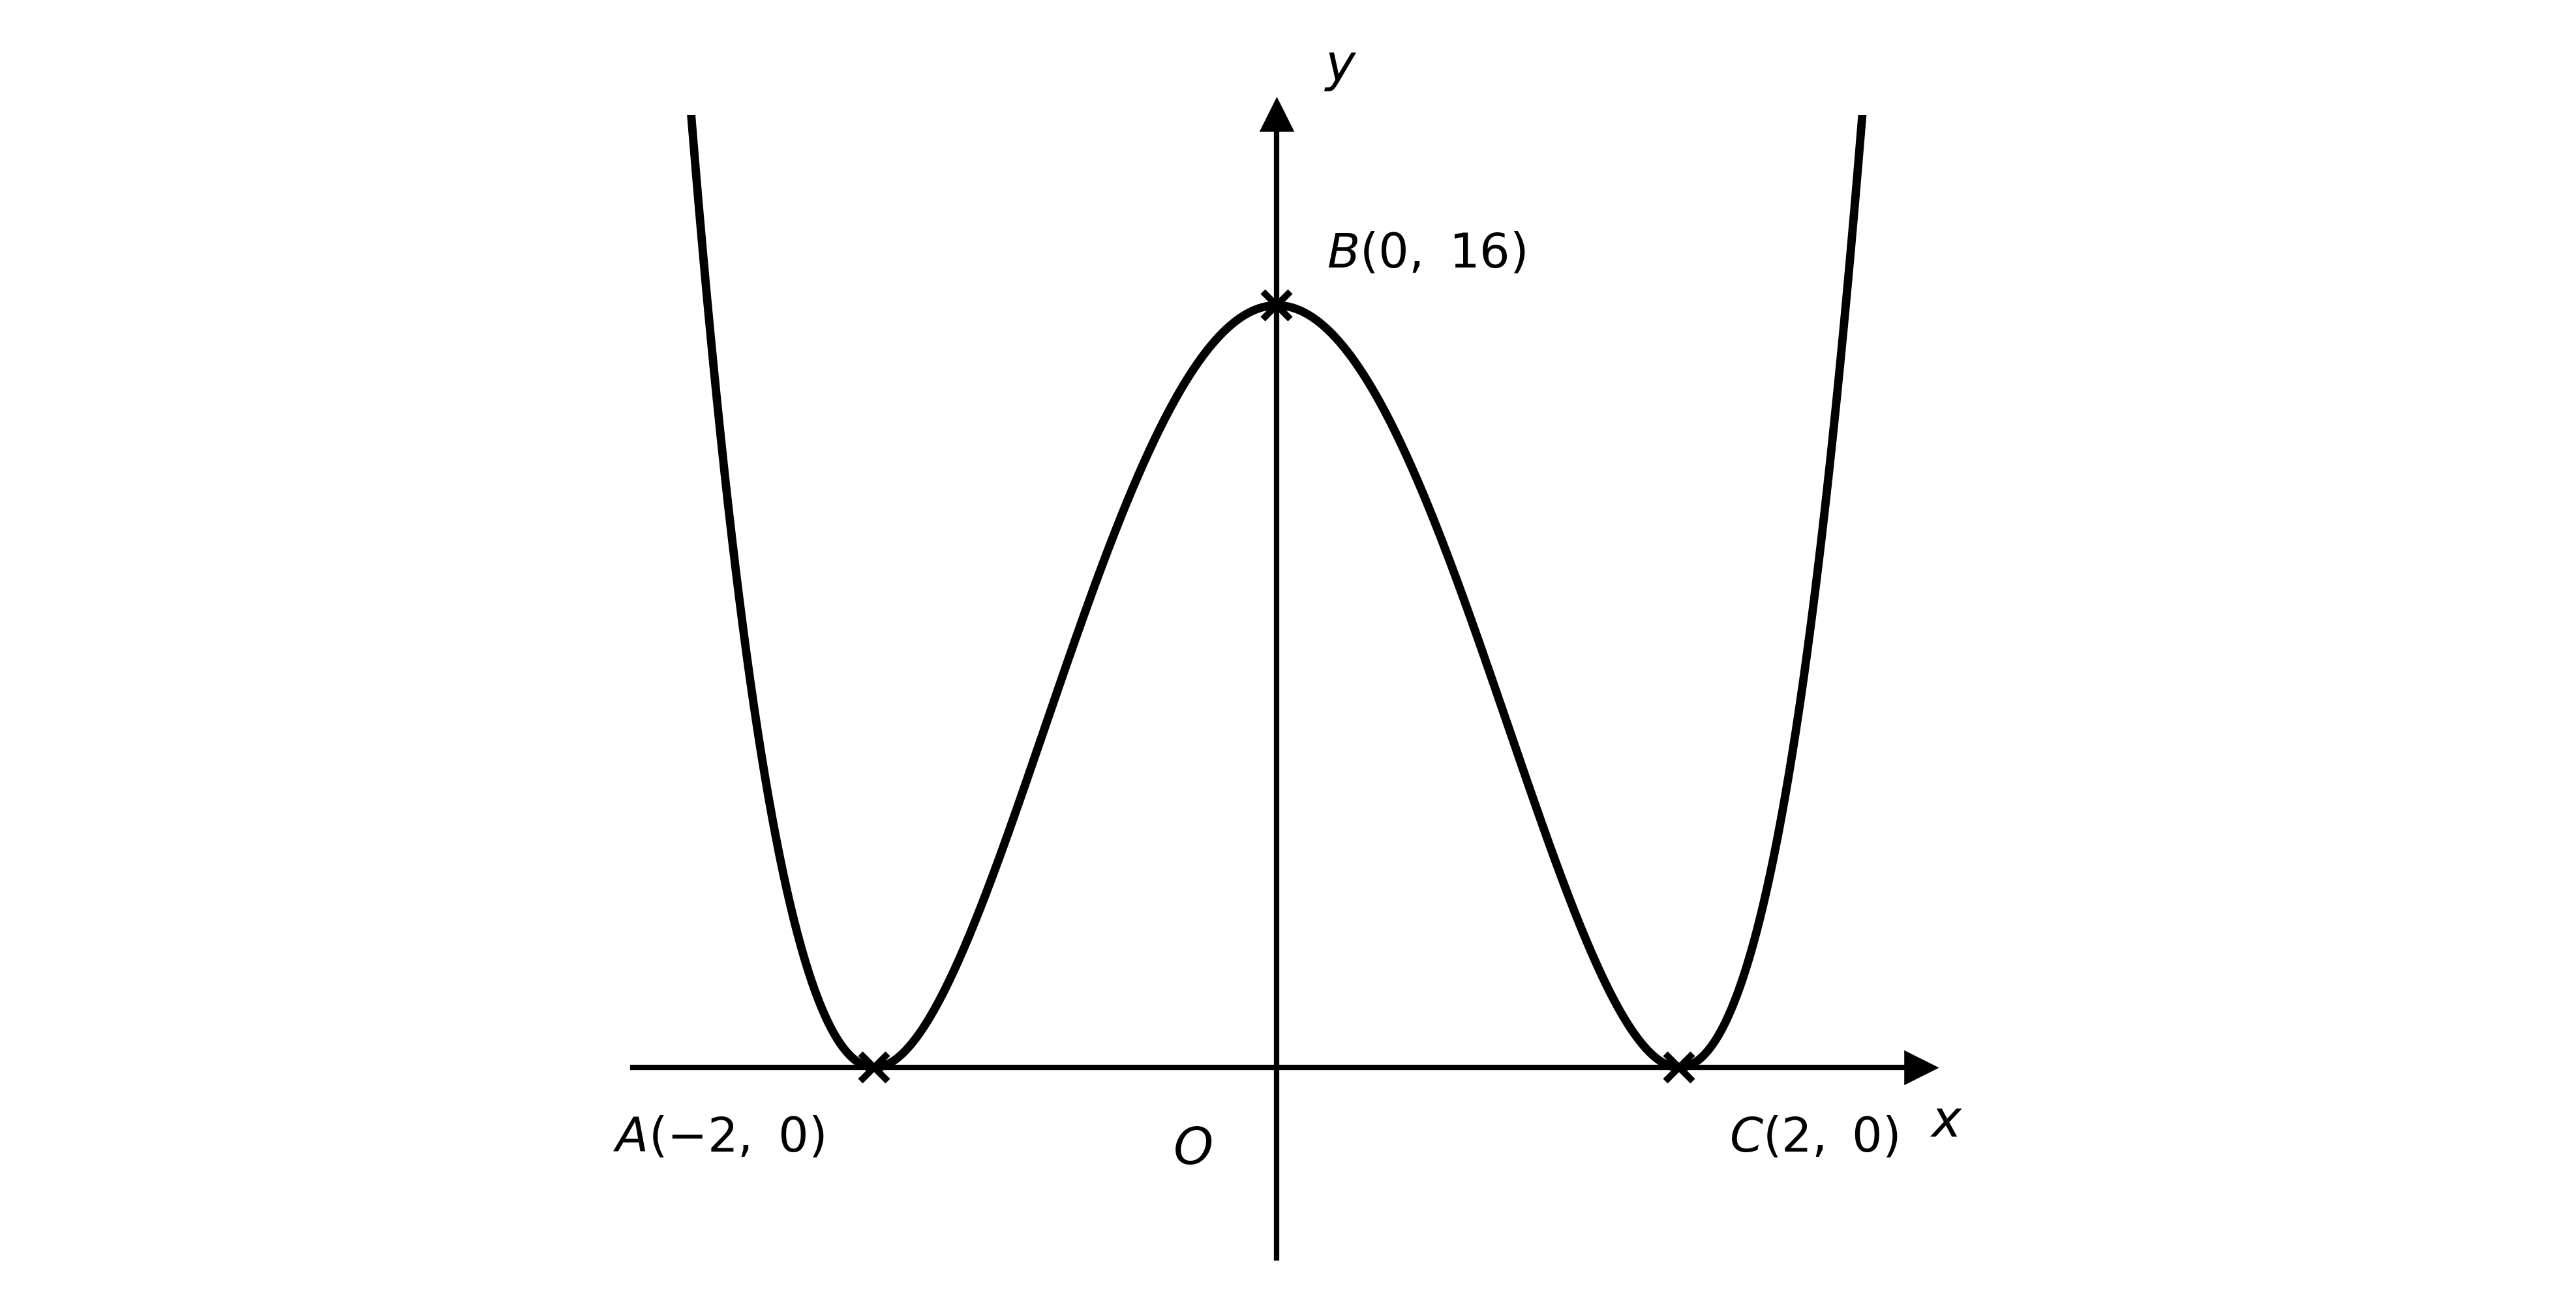
The diagram shows the graph of . The stationary points and are marked on the diagram.

On separate diagrams, sketch the following graphs.
(i)
(ii)
On each diagram, state the coordinates of the images of and under the given transformation.
Describe fully, in order, the sequence of transformations that maps the graph of onto each of the following graphs.
(i)
(ii)
Given that , find an expression for , where is obtained by applying the following sequence of transformations to , in this order.
\begin{pmatrix} 2 \\ 0 \end{pmatrix}\begin{pmatrix} 0 \\ -3 \end{pmatrix}The function is defined by .
(i) Sketch the graph of .
(ii) On the same axes, sketch the graph of , indicating the line of symmetry.
Label the coordinates of the points where each graph crosses the coordinate axes.
(i) Find an expression for .
(ii) Find an expression for \tfrac{1}{9}\left[\text{p}(x) + 16\right], giving your answer in its simplest form.
(iii) Hence state what the sequence of transformations represented by \tfrac{1}{9}\left[\text{p}(x) + 16\right] does to the graph of .
The diagram shows the graph of , where and .

The points and are where the graph meets the coordinate axes.
Write down, in terms of , the coordinates of and .
Sketch the graph of , labelling the images of and and stating their coordinates in terms of .
Given that is three times as far from the origin as , find the value of .
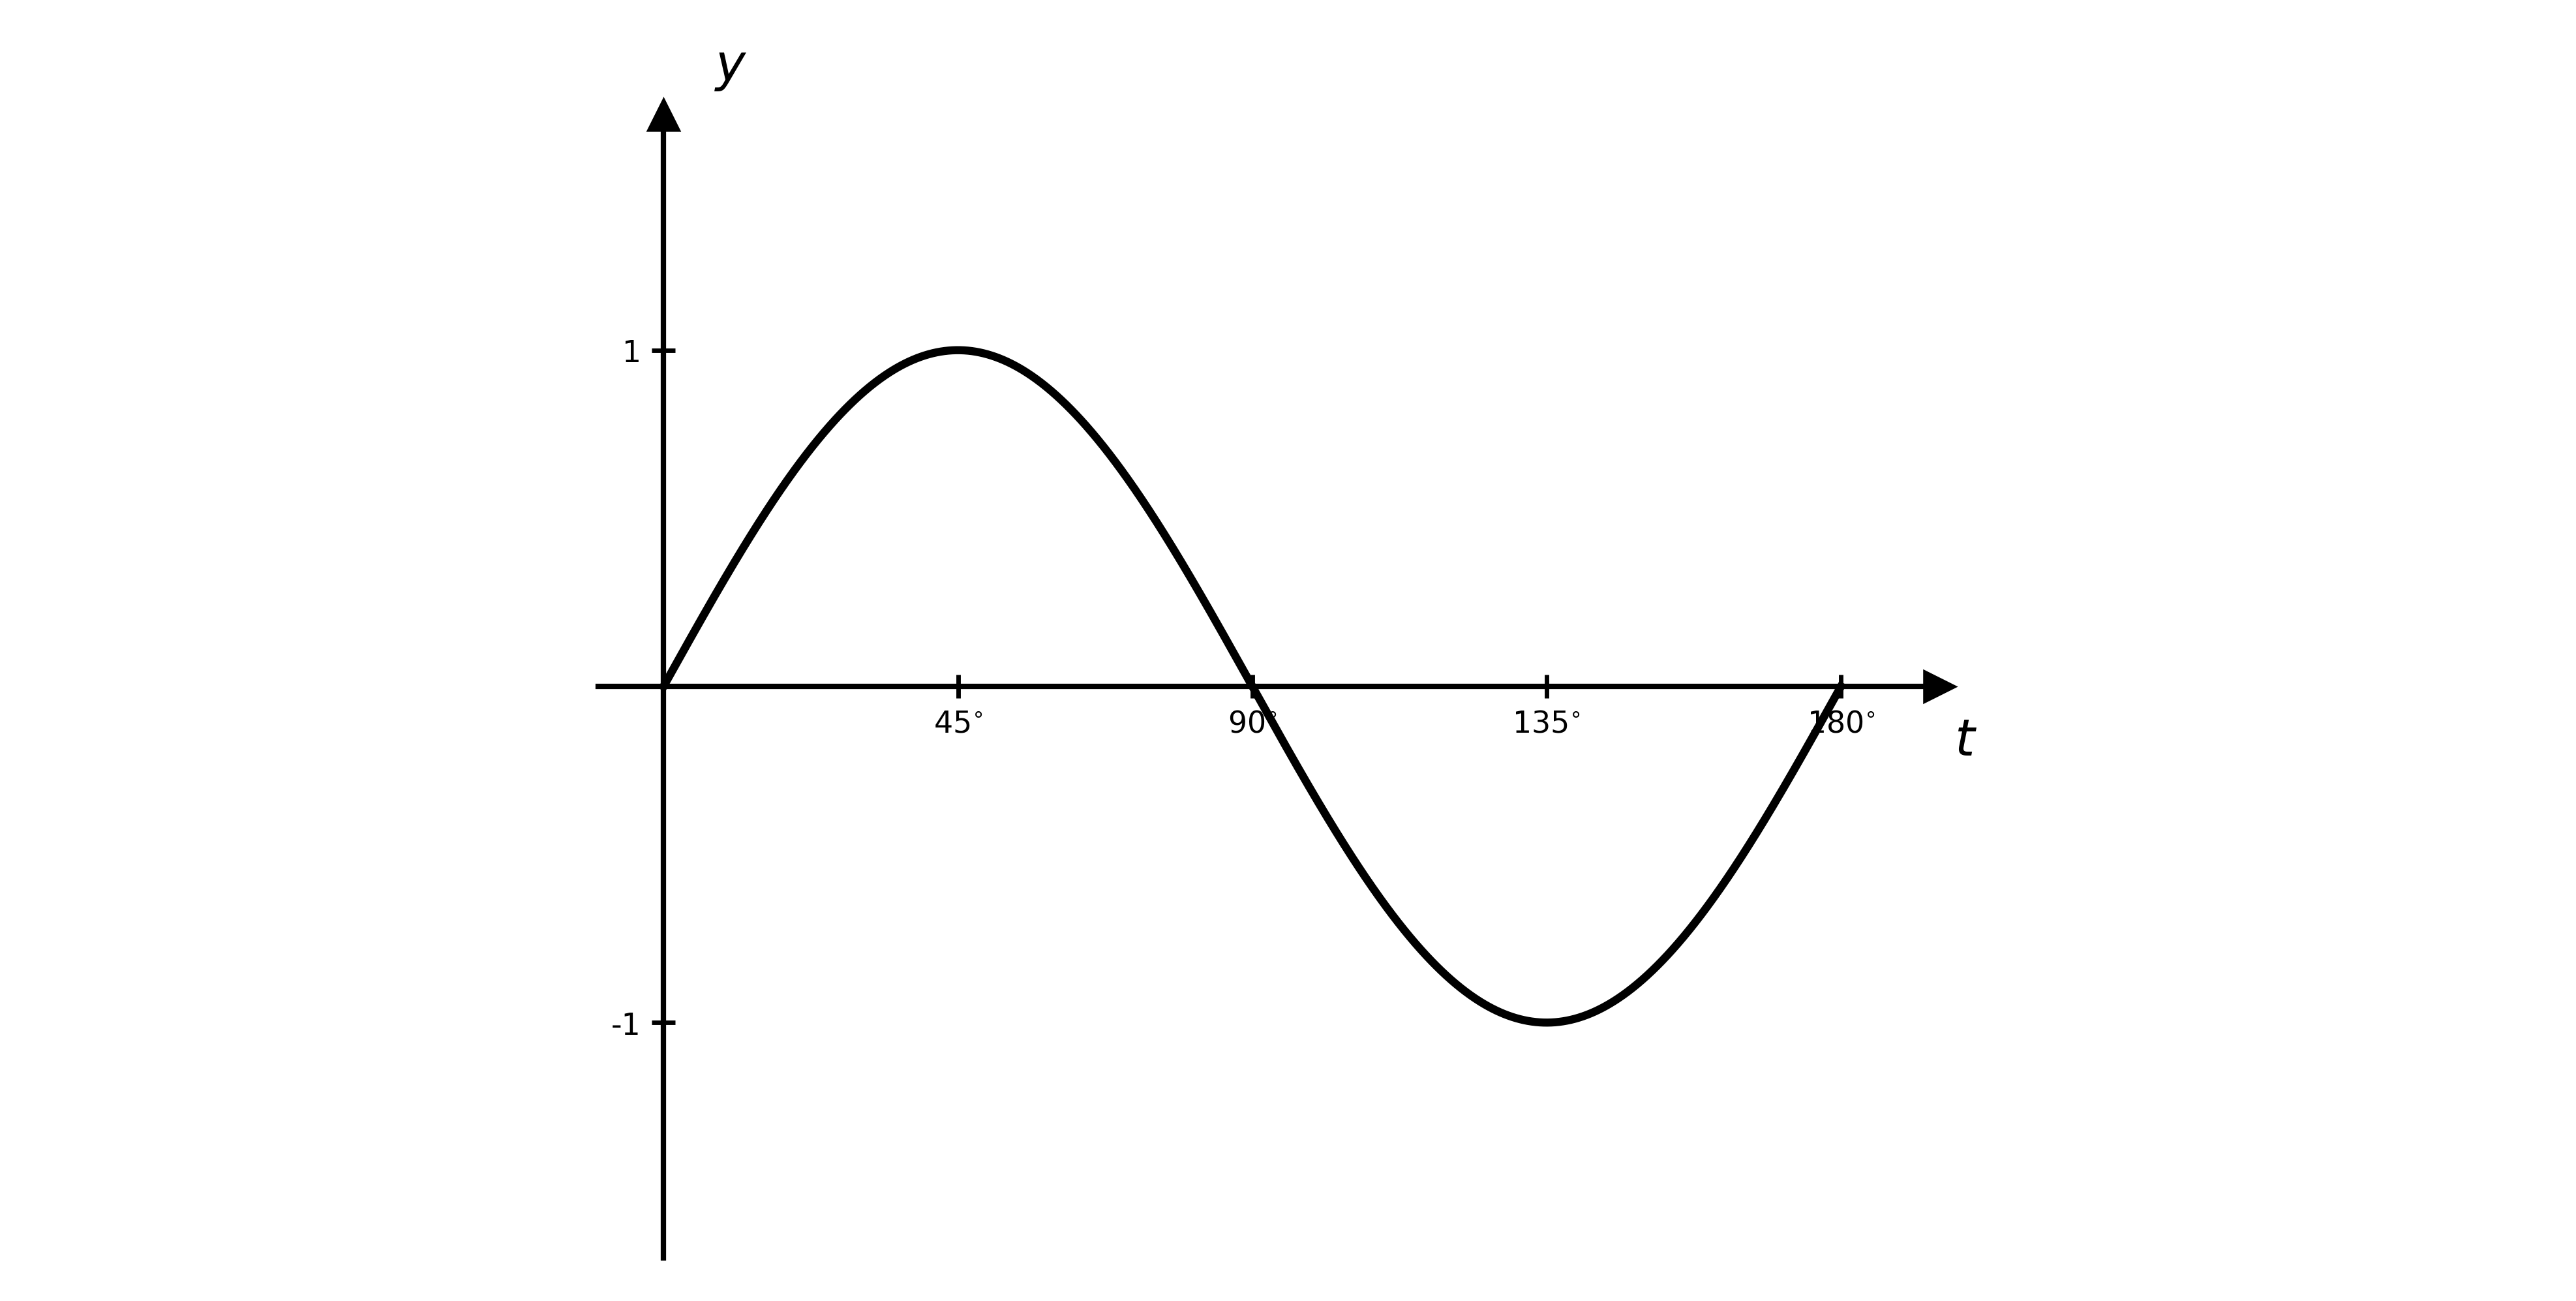
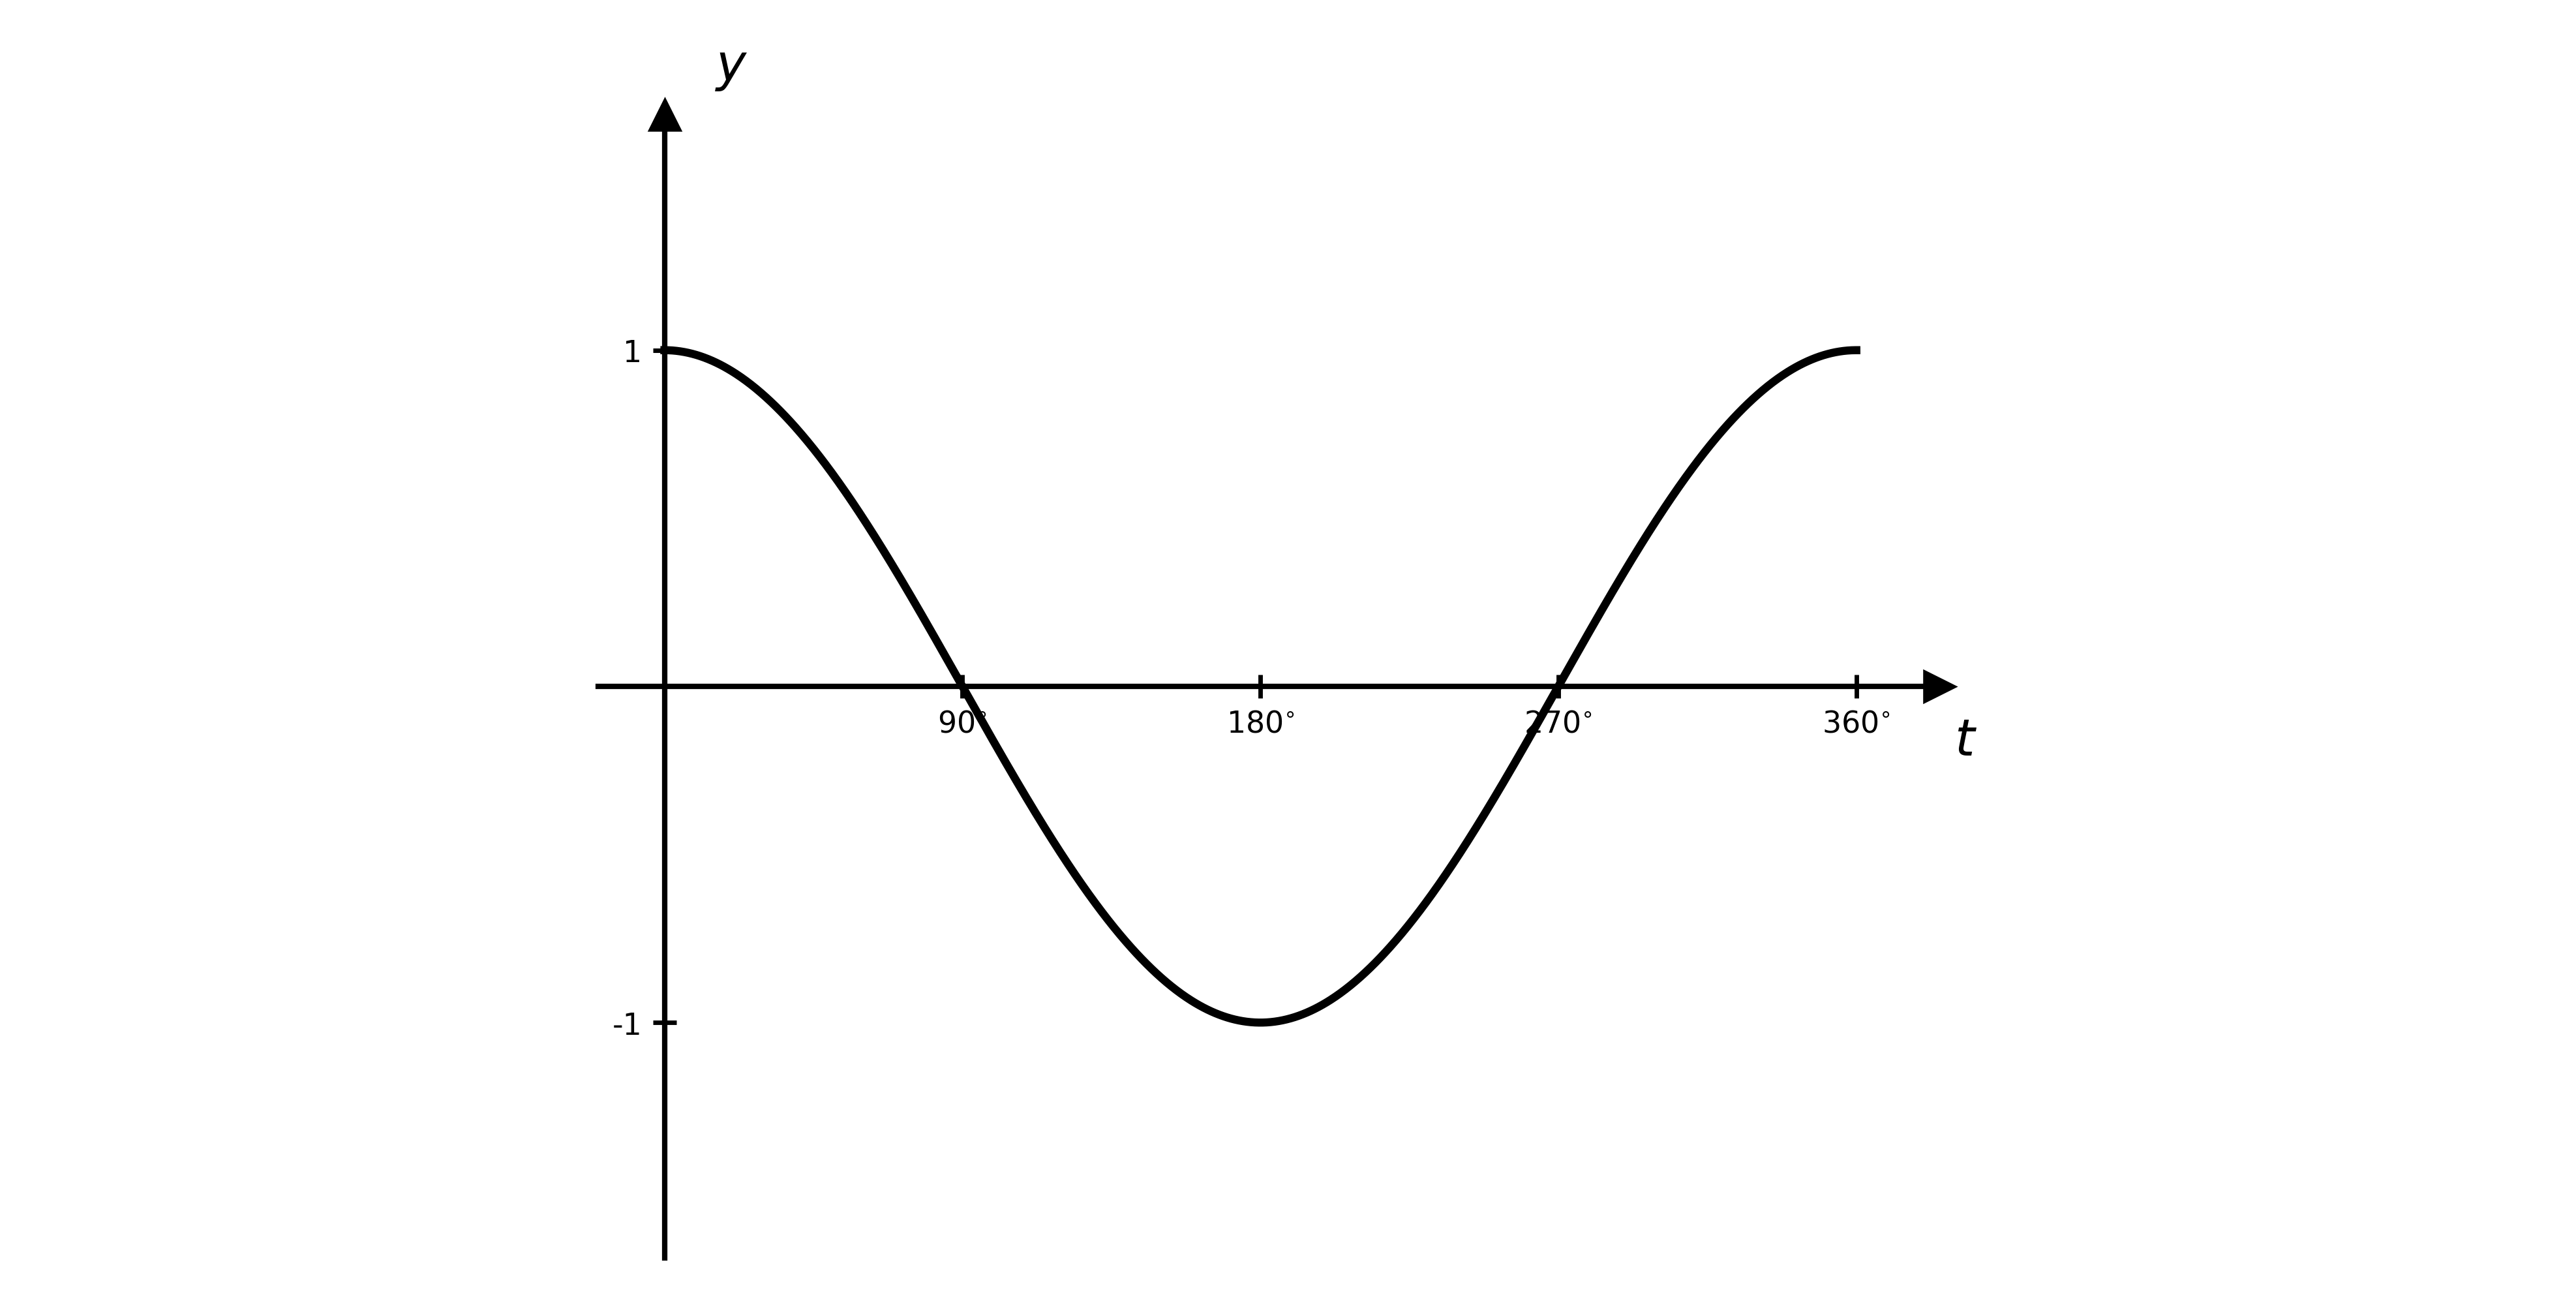
The diagram shows the graph of , where for .

(i) Write down the maximum value of .
(ii) Write down the first value of at which this maximum occurs.
(i) Write down the minimum value of .
(ii) Write down the first value of at which this minimum occurs.
Describe, in terms of , the combination of transformations that maps the graph of onto the graph of for .
The graph of is transformed by the following sequence of transformations, applied in this order.
\begin{pmatrix} 0 \\ 2 \end{pmatrix}Write down, in terms of , the equation of the resulting graph.
The graph of is transformed by the following sequence of transformations, applied in this order.
\begin{pmatrix} 2 \\ 0 \end{pmatrix}\begin{pmatrix} 0 \\ 4 \end{pmatrix}Write down, in terms of , the equation of the resulting graph.
The diagram shows the graph of , where for .

(i) Write down the maximum value of .
(ii) Write down the value of at which this maximum first occurs.
Find, in terms of , a combination of transformations that maps the graph of onto the graph of for .
The diagram shows the graph of , where , with a non-zero constant.

(i) Write down the equations of the asymptotes of .
(ii) Determine the equations of the asymptotes of the graph of .
The function is defined by \text{f}(x) = -2\text{g}\left(\tfrac{1}{3}x + 3\right) - 4. Determine the domain and range of .
The function is defined by .
Show that the graph of maps onto the graph of its inverse under the transformation .
The diagram shows the graph of . The maximum point and the -axis intercepts and are marked on the diagram.

On separate diagrams, sketch the following graphs.
(i)
(ii)
On each diagram, mark the coordinates of the images of the points , and under the given transformation.
Describe fully, in order, the sequence of transformations that maps the graph of onto each of the following graphs.
(i)
(ii)
The function is defined by . Find an expression for , where is obtained by applying the following sequence of transformations to , in this order.
\begin{bmatrix} - 3 \\ 0 \end{bmatrix}The diagram shows the graph of , where .

The points , and are where the graph meets the coordinate axes.
Sketch the graph of , labelling the images of , and .
Suggest a combination of at least two transformations that maps , and so that none of them lies on a coordinate axis. Give your answer as an expression in terms of .
The diagram shows the graph of , where is a positive constant. The maximum point , the minimum point and the -axis intercept are marked on the diagram.

On separate diagrams, sketch the following graphs, marking the coordinates of the images of , and in terms of .
(i)
(ii)
Describe, in order, a sequence of transformations that maps the graph of onto each of the following graphs.
(i) , for the case when
(ii)
How, if at all, would your answer to part (a)(i) change if , or if ?
A function is defined by , where is a non-zero constant.
Show that \text{f}^{-1}(x) = \tfrac{1}{k}\,\text{f}\left(\tfrac{1}{k}x\right).
The diagram shows the graph of , where and . The points , and are where the graph meets the coordinate axes.

Write down, in terms of , the coordinates of , and .
Sketch the graph of , labelling the images of , and and stating their coordinates in terms of .
Suggest, in terms of , a combination of at least two transformations for which , and move to new positions but each remains on its original axis.
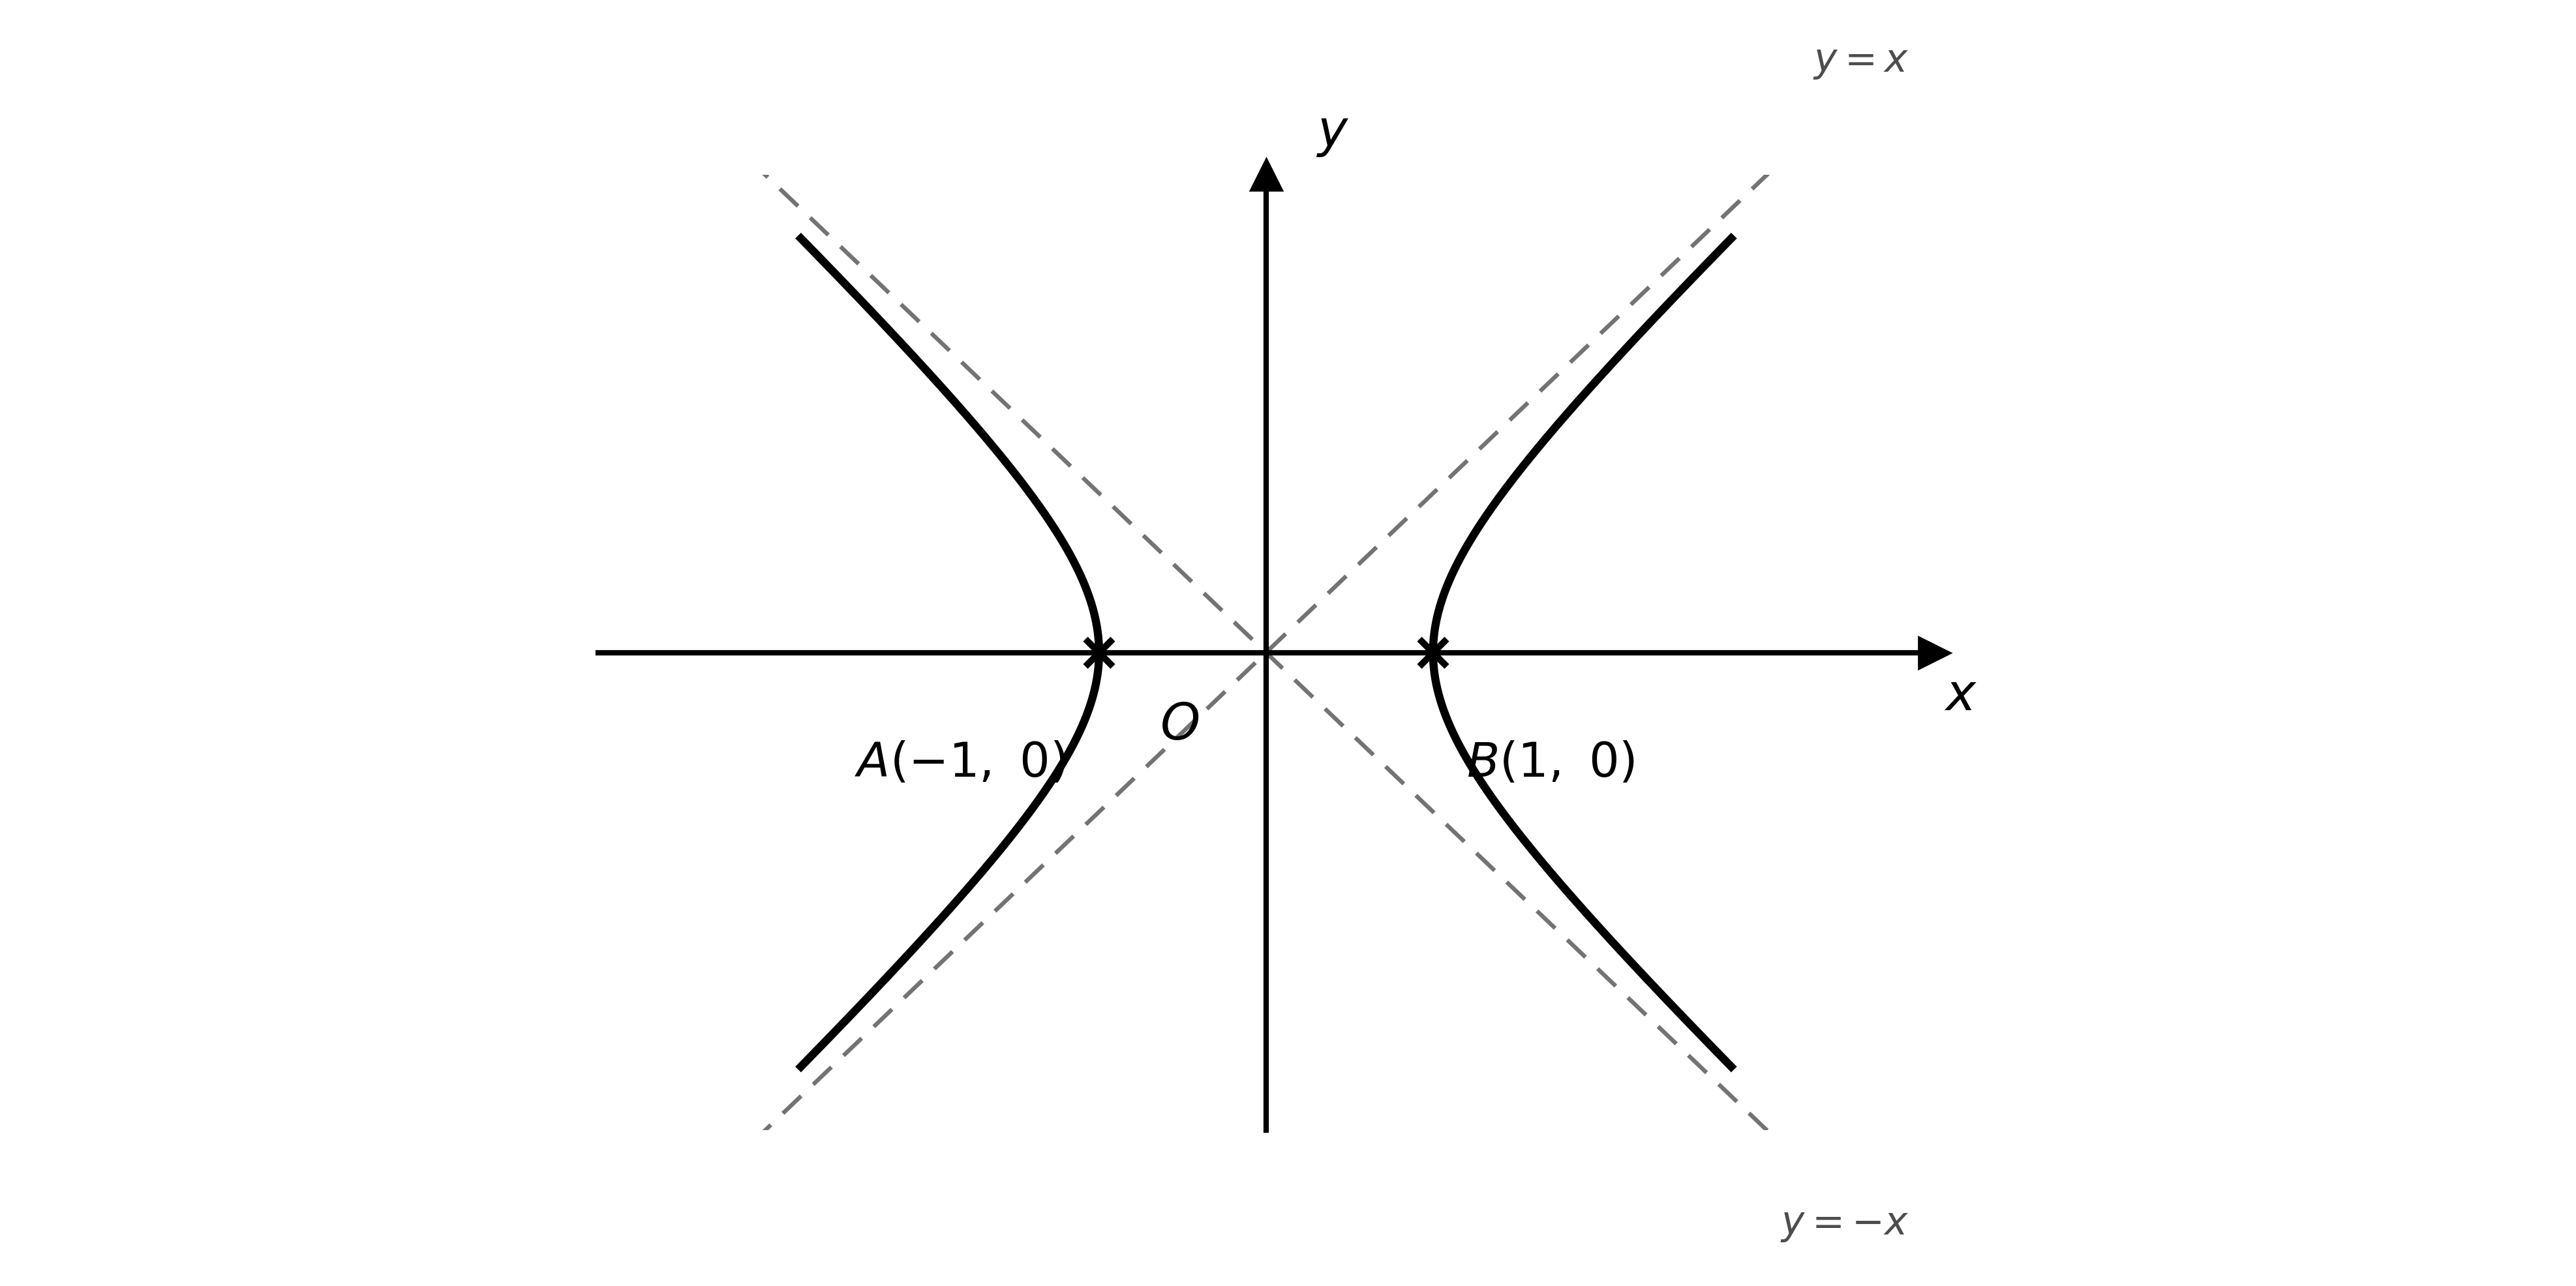
The diagram shows the graph of , which has asymptotes and and meets the -axis at the points and .

Determine the coordinates of the images of and on the graph of .
(i) Determine the equations of the asymptotes of the graph of .
(ii) Find the domain of .