Which of these graphs shows the area as varies?
Question
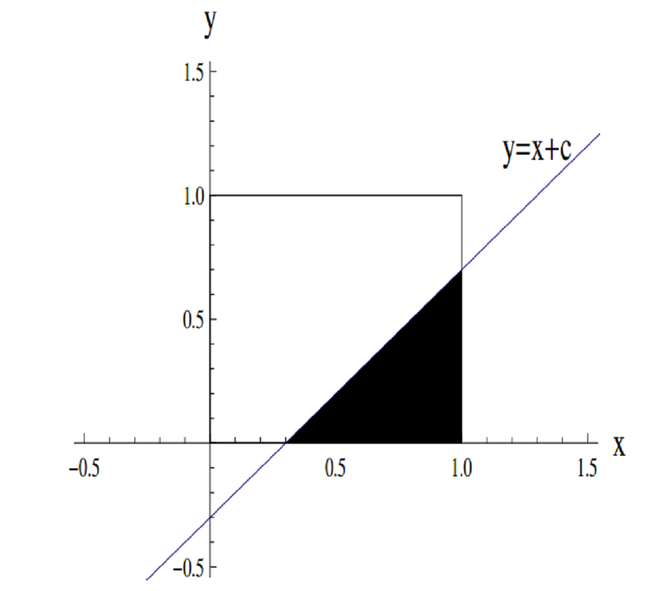
Shown below is a diagram of the square with vertices and the line . The shaded region is the region of the square which lies below the line; this shaded region has area .
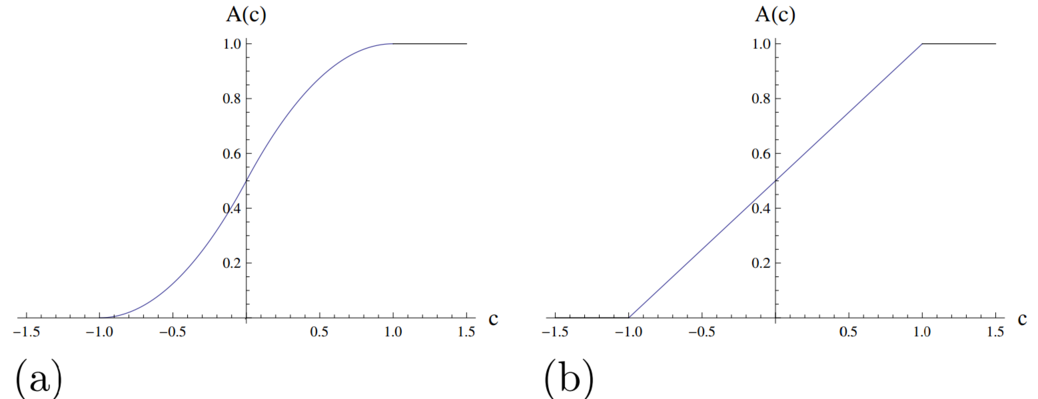
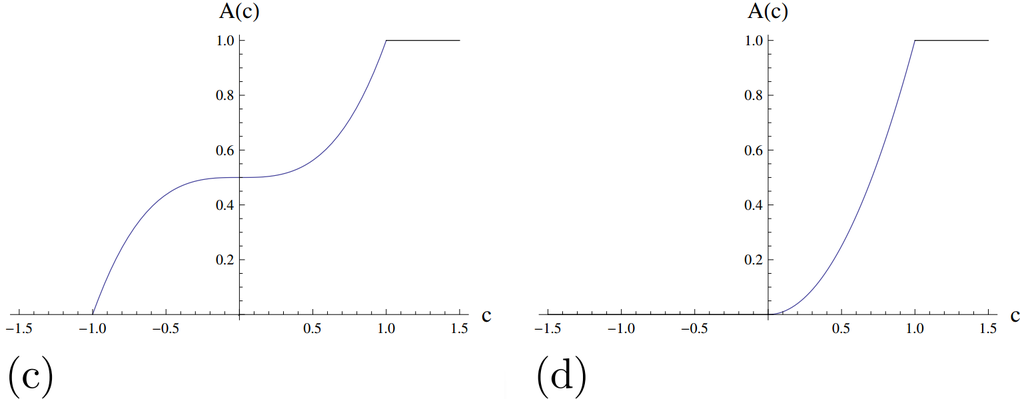
Which of the following graphs shows as varies?
Suggestion
What values of give a positive area?
When will the area be growing quickly and when slowly?
Which of the graphs given are in line with this?
Alternatively; can we come up with an explicit formula for , one that tells us what is terms of ?
Could we consider the two cases and separately?
What shape would the graph of such a formula be?
Solution
The area is first positive once becomes greater than , which is when the line first touches the square.
As increases, the area increases more and more quickly (as more of the line lies within the square) until (when is a diagonal of the square).
The area then increases more and more slowly until at which point reaches its maximum value.
The graph with this shape is (a).
Algebraically, looking at the areas of triangles, when , we have and when , we have
Thus for , we have part of a vertex-down parabola, while for , we have part of a vertex-up parabola.
The only possible answer is (a).