Picture the process II
Excerpt: Students sketch graphs and match up existing graphs that go with descriptions of real world physical processes. As a further exercise, an equation can be matched up with each process and graph.
Processes
Here are descriptions of nine real-world processes. For each, try to sketch a suitable graph. If you are not familiar with the background science, then try to use what you do know to reason through what a graph might look like.
You do not need to calculate or plot exact points, just sketch graphs that give the general shape.
As you produce your sketches, make a list of the features that you are considering.
Number of rapidly dividing bacteria present in a food-limited environment, starting from a small initial sample.
Concentration in the blood of a drug following an injection.
Angle of oscillation of a real pendulum of length metre in air.
Volume (in litres) against pressure (in atmospheres) for mole of an ideal gas at .
Vertical distance travelled by a small, heavy ball dropped from a plane.
Rate of reaction of a catalysed reaction in terms of the concentration of reagent.
Number of rapidly dividing bacteria present in a food-rich environment, starting from a small initial sample.
Hours of daylight per day in a town in the far northern hemisphere.
Model of the distance of the Earth from the Sun in astronomical units.
Graphs
Hopefully you have now sketched graphs for some of the nine processes described in the previous section. What features did you consider as you did this?
Below is a possible graph for each process (but they’re muddled up). Can you match a graph to each process?
How do the graphs below compare to those you sketched? If you sketched something different, can you identify the assumptions that you made and those that might have led to the graphs below?
Hopefully you have now matched a graph to each process.
Can you suggest an equation for each process/graph pair?
Process/graph pairs
Here is each graph matched to its process.
-
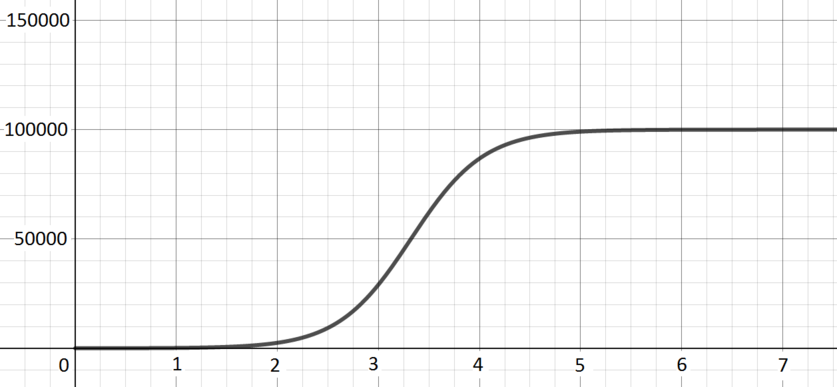
Number of rapidly dividing bacteria present in a food-limited environment, starting from a small initial sample.
Graph H The number initially increases exponentially, as the bacteria divide repeatedly, but as the number of bacteria increases the lack of food becomes an issue and so growth is much less fast. -
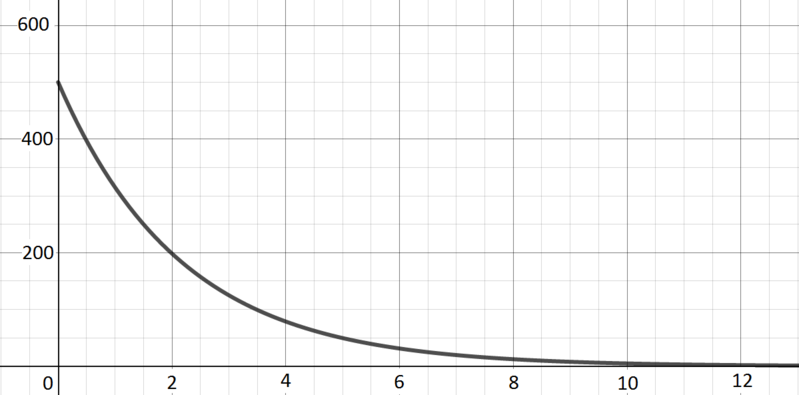
Concentration in the blood of a drug following an injection.
Graph G There is a high level of the drug at the start, but it then drops off exponentially as the body metabolises the drug. -
Angle of oscillation of a real pendulum of length metre in air.
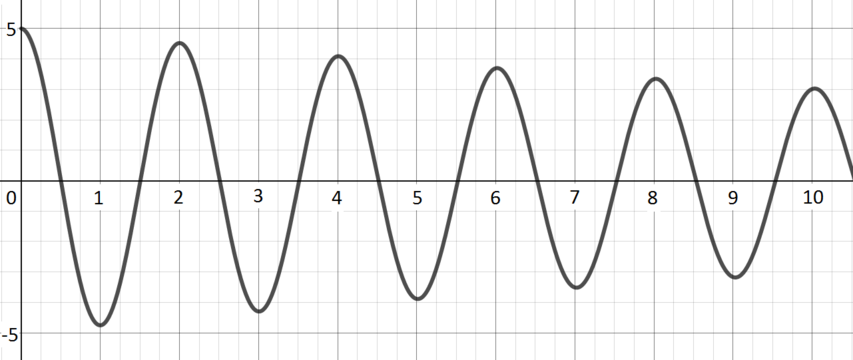
Graph C The angle oscillates between two extremes, but those extremes become less extreme over time: the pendulum loses energy (through friction, for example) and so swings less far. -
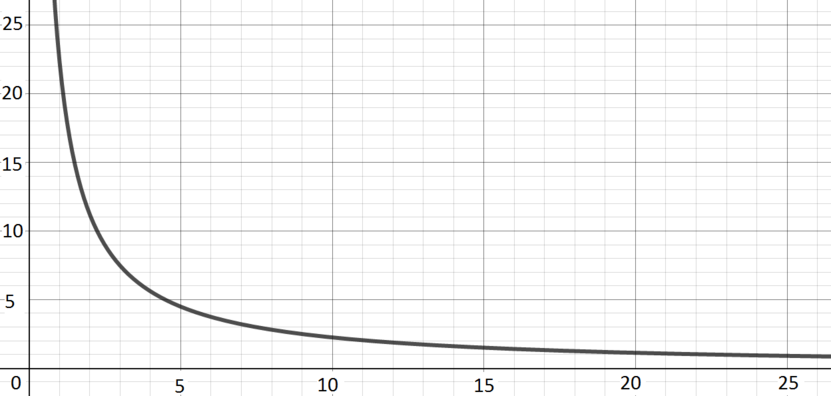
Volume (in litres) against pressure (in atmospheres) for mole of an ideal gas at .
Graph I Volume is inversely proportional to pressure (this makes intuitive sense, a given amount of gas takes up less volume as the pressure on it increases), so we get a reciprocal curve. -
Vertical distance travelled by a small, heavy ball dropped from a plane.
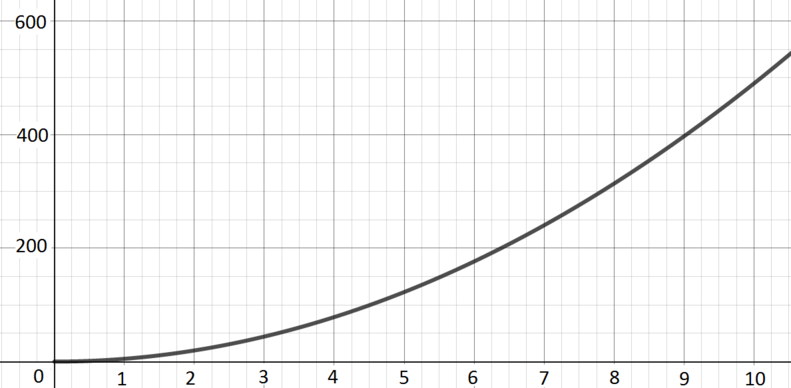
Graph B If we ignore effects of air resistance and so on, the key thing is gravity, which leads to the ball experiencing constant acceleration. This gives rise to a quadratic curve. -
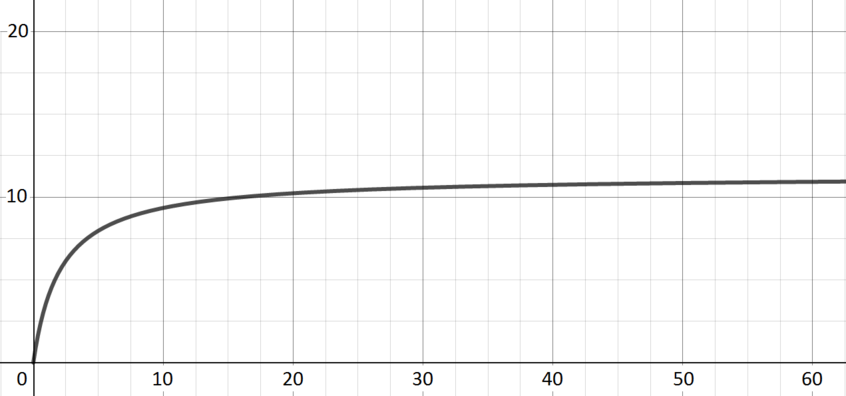
Rate of reaction of a catalysed reaction in terms of the concentration of reagent.
Graph E Introducing some reagent leads to a rapid increase in the rate of reaction; continuing to introduce reagent has a less dramatic effect but does still increase the rate of reaction until saturation is reached. -
Number of rapidly dividing bacteria present in a food-rich environment, starting from a small initial sample.
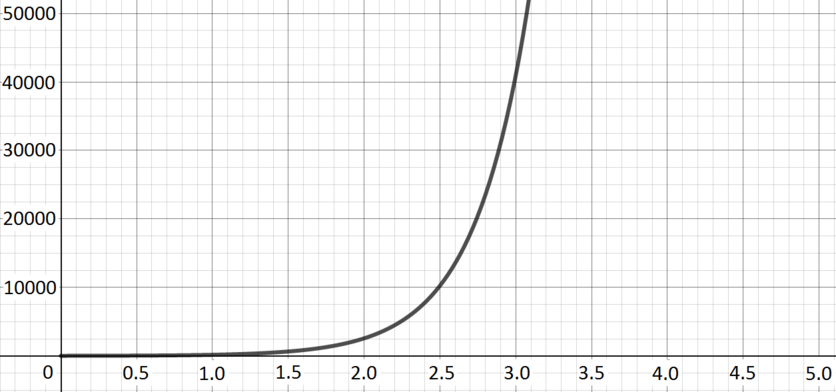
Graph D The number of bacteria increases exponentially. -
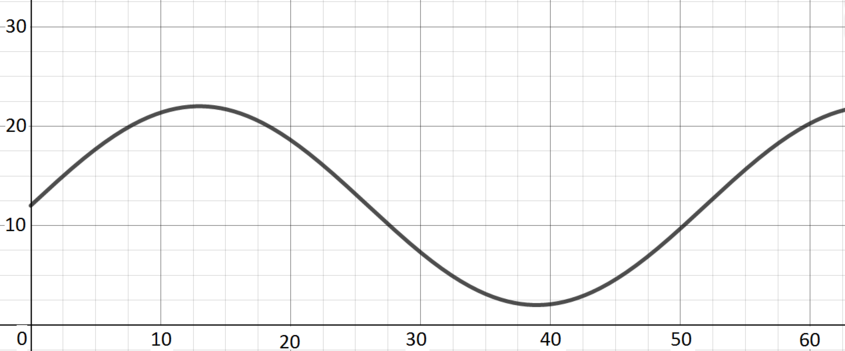
Hours of daylight per day in a town in the far northern hemisphere.
Graph F Over the course of a year, the number of hours of daylight will increase to a maximum in the middle of summer (just below ) and decrease to a minimum in the middle of winter (just above ) and return to its starting point. -
Model of the distance of the Earth from the Sun in astronomical units.
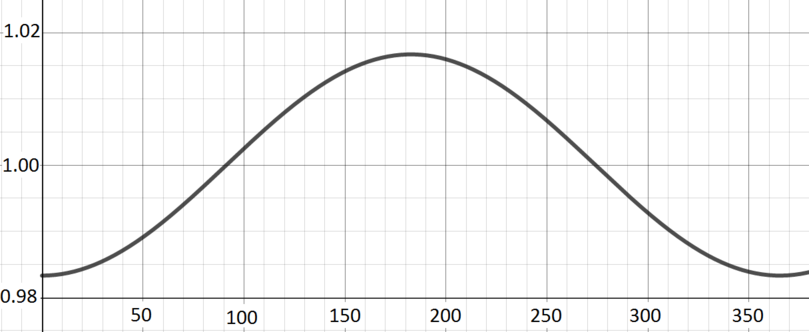
Graph A One astronomical unit is defined to be the average distance of the Earth from the Sun. As the Earth moves round the Sun in its elliptical orbit over the course of the year, it will move from slightly larger than to slightly less than and back again.
Equations
Below is a possible equation for each process/graph pair (but they’re muddled up). Can you match an equation to each process/graph?
Can you explain the numbers in these equations? They are all chosen to be physically sensible given suitable units. What might the units be for each process/graph/equation?
Process/graph/equation triples
Here is each process with its graph and equation. We have repeated in blue the description from a previous section linking processes and graphs, and where appropriate have added additional comments on the equation.
-
Number of rapidly dividing bacteria present in a food-limited environment, starting from a small initial sample.
Graph H; The number initially increases exponentially, as the bacteria divide repeatedly, but as the number of bacteria increases the lack of food becomes an issue and so growth is much less fast. When is very small, the term is more important than in the denominator, and is rather small (but positive). When is very large, the term in the denominator is extremely small, and so tends to . -
Concentration in the blood of a drug following an injection.
Graph G; There is a high level of the drug at the start, but it then drops off exponentially as the body metabolises the drug. This equation corresponds to exponential decay. -
Angle of oscillation of a real pendulum of length metre in air.
Graph C; The angle oscillates between two extremes, but those extremes become less extreme over time: the pendulum loses energy (through friction, for example) and so swings less far. The cosine term here gives the periodic oscillation. The gives the damping that comes from the pendulum’s loss of energy. -
Volume (in litres) against pressure (in atmospheres) for mole of an ideal gas at .
Graph I; Volume is inversely proportional to pressure (this makes intuitive sense, a given amount of gas takes up less volume as the pressure on it increases), so we get a reciprocal curve.) The ideal gas law tells us that . On the left, is the pressure and the volume. On the right, is the amount of gas, is the ideal gas constant, and is the temperature; in our context these are all constants. -
Vertical distance travelled by a small, heavy ball dropped from a plane.
Graph B; If we ignore effects of air resistance and so on, the key thing is gravity, which leads to the ball experiencing constant acceleration. This gives rise to a quadratic curve. When the ball is dropped, we can think of it has having zero initial velocity, and its acceleration is approximately metres per second per second (due to gravity), which leads to the equation (coming from ). -
Rate of reaction of a catalysed reaction in terms of the concentration of reagent.
Graph E; Introducing some reagent leads to a rapid increase in the rate of reaction; continuing to introduce reagent has a less dramatic effect but does still increase the rate of reaction until saturation is reached. When is small, the dominant term in the denominator is , and the function grows approximately linearly with a gradient of approximately . As increases, it becomes the more significant term in the denominator, and the function gets closer and closer to the value . -
Number of rapidly dividing bacteria present in a food-rich environment, starting from a small initial sample.
Graph D; The number of bacteria increases exponentially. -
Hours of daylight per day in a town in the far northern hemisphere.
Graph F; Over the course of a year, the number of hours of daylight will increase to a maximum in the middle of summer (just below ) and decrease to a minimum in the middle of winter (just above ) and return to its starting point. The units on the horizontal axis here are weeks. This choice leads to the appearance of in the argument of the sine, in order to get the right period. The number of hours of daylight varies around an average of , which is why we have a at the beginning here, and the scales the sine so that we get a function varying between and rather than and . -
Model of the distance of the Earth from the Sun in astronomical units.
Graph A; One astronomical unit is defined to be the average distance of the Earth from the Sun. As the Earth moves round the Sun in its elliptical orbit over the course of the year, it will move from slightly larger than to slightly less than and back again. The units on the horizontal axis here are days, and that contributes to the in the argument of the cosine. The very small in front of the cosine reflects the fact that the Earth’s orbit is pretty close to being circular: our distance from the Sun does not change very much over the course of a year.