The diagram shows the graph of y=f(x). The marked point B \left( 4, 8 \right) lies on the graph, and the graph meets the origin at the marked point A.
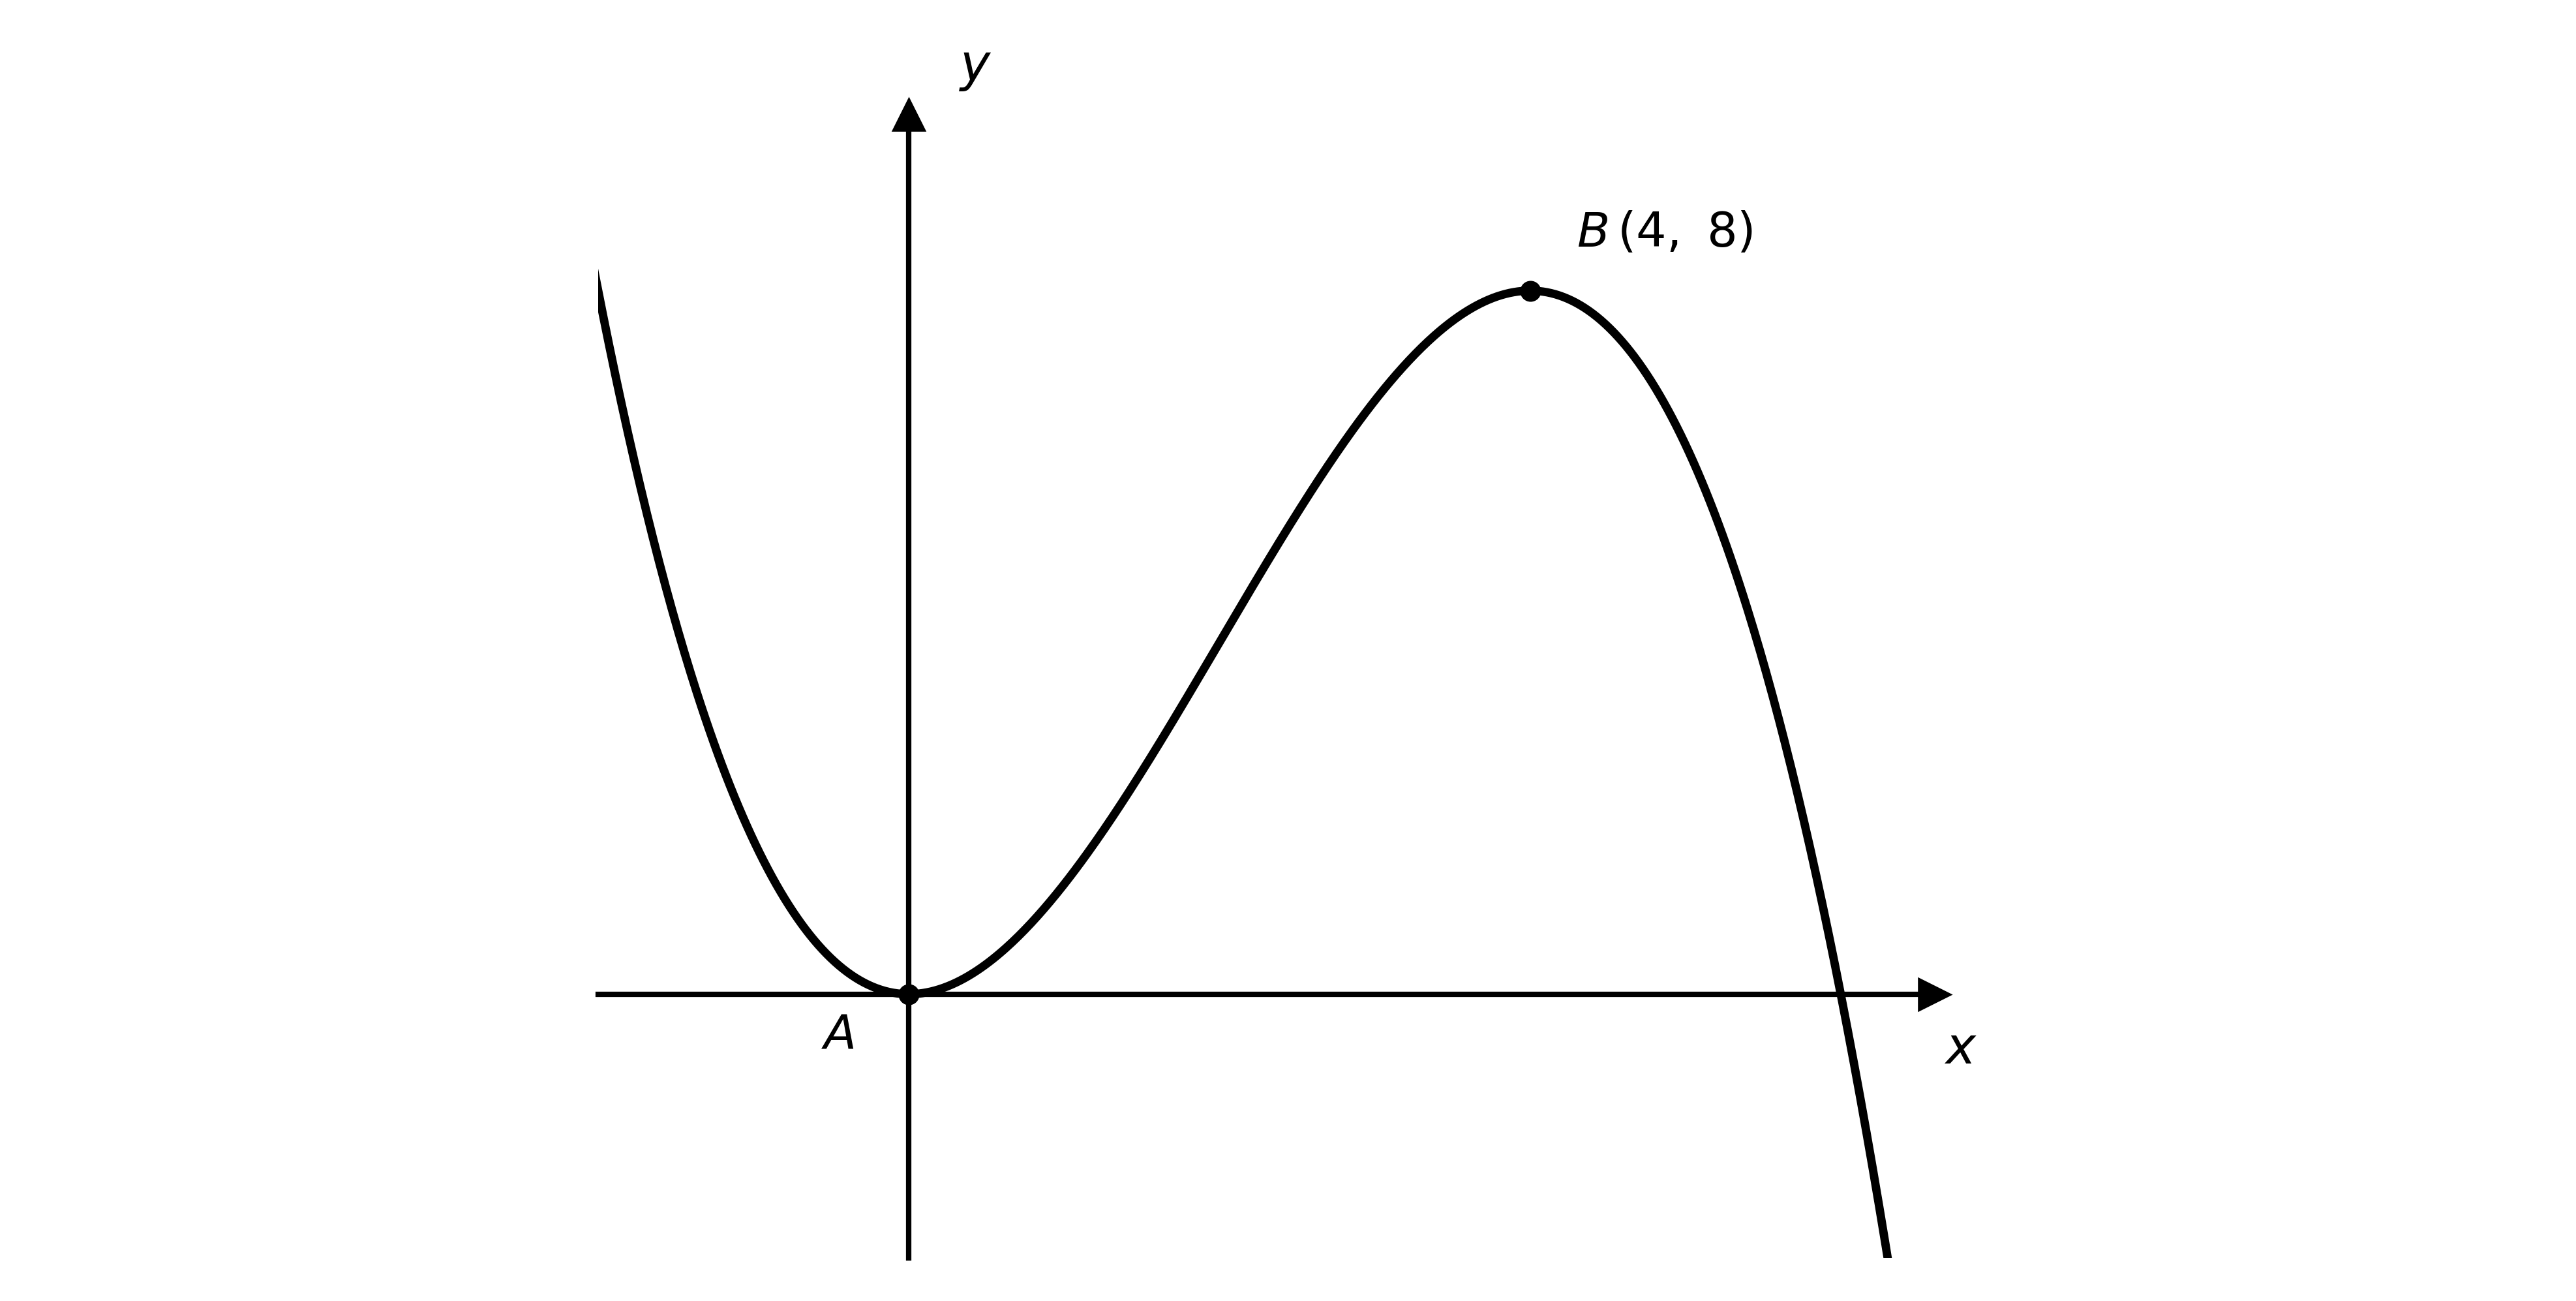
Consider the three transformations of the graph
y=f(−x)
y=f(ax)
y=f(x)+b
where a and b are constants and a>0.
State which of the transformations satisfies each of the following conditions, determining the range of possible values of a or b where relevant:
(i) the images of the two marked points lie on opposite sides of the x-axis;
(ii) the image of point B has coordinates \left( x, y \right), where −6<x<−3;
(iii) the image of point B has coordinates \left( x, y \right), where 0<x<3.