Short Run Aggregate Supply (SRAS) (Cambridge International A-Level Economics)
An Introduction to short-run aggregate supply (SRAS)
-
Aggregate supply (AS) is the total volume of goods and services that firms in an economy are willing and able to produce at a given price level over a given time period
- It represents the relationship between the average price level and the real output that producers supply
- In the short run, at least one factor of production is fixed - typically capital
The short-run aggregate supply curve
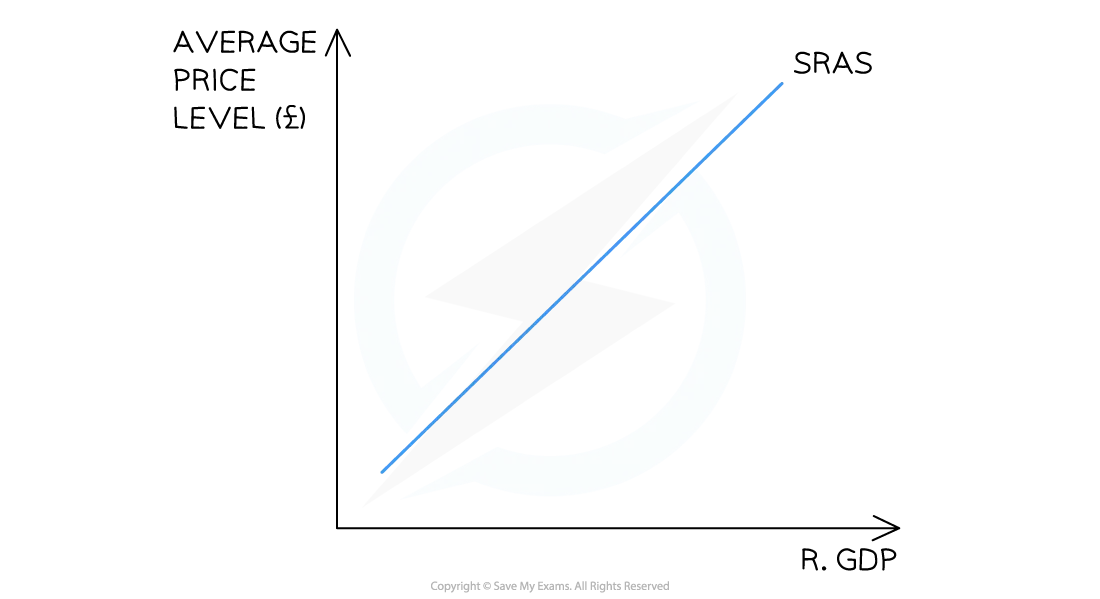
*The SRAS is upward-sloping. As price levels rise, firms are incentivised to supply more *
Diagram analysis
-
The SRAS curve is upward sloping - as the average price level rises, firms are incentivised to increase output
-
Two reasons explain the upward slope:
- The SRAS is the combined supply of all individual firm supply curves in the economy, which are also upward sloping
- As firms increase output towards full capacity, unit costs of production rise - less efficient resources are brought into use and factor prices are bid up, so firms require higher prices to justify supplying more
A movement along the SRAS curve
- Whenever there is a change in the average price level (AP) in an economy, there is a movement along the short-run aggregate supply(SRAS) curve
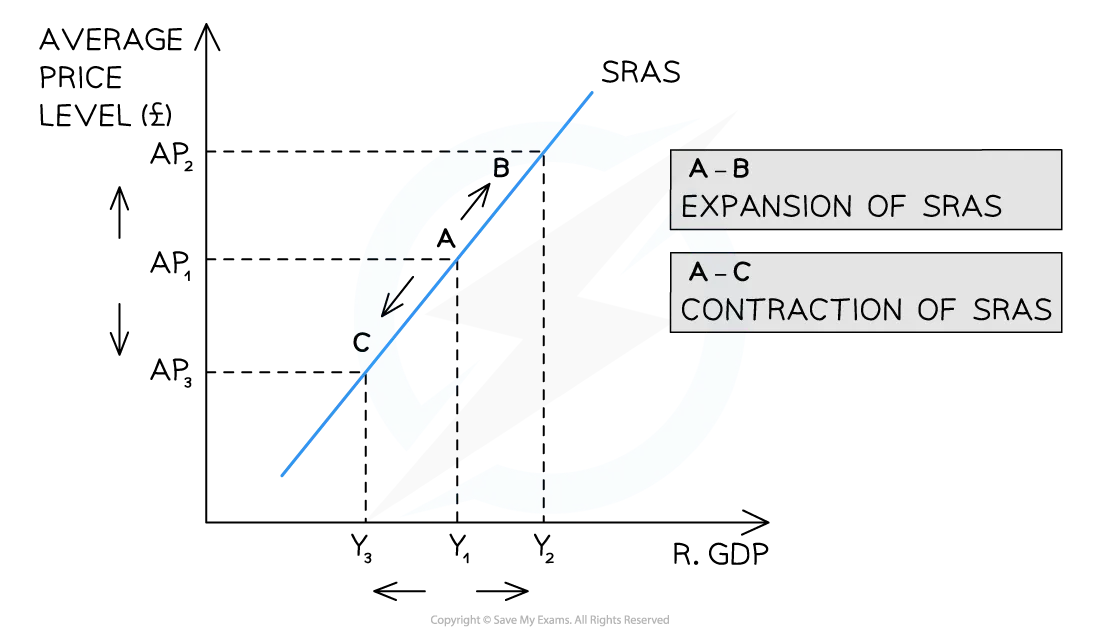
An increase or decrease in the average price level (AP) causes a movement along the short-run aggregate supply (SRAS) curve, leading to a contraction or expansion of SRAS
Diagram analysis
-
Whenever there is a change in the average price level (AP), there is a movement along the SRAS curve
-
An increase in the AP (ceteris paribus) from AP1 to AP2 leads to a movement along the SRAS curve from A to B
- There is an expansion of real GDP from Y1 to Y2
-
A decrease in the AP (ceteris paribus) from AP1 to AP3 leads to a movement along the SRAS curve from A to C
- There is a contraction of real GDP from Y1 to Y3
-
Factors that cause the entire SRAS curve to shift
-
Shifts in SRAS are caused by changes in conditions of supply in an economy; this usually means changes in the costs of production
- Changes in the cost of raw materials and energy
- Changes in exchange rates (E/R)
- Changes in tax rates
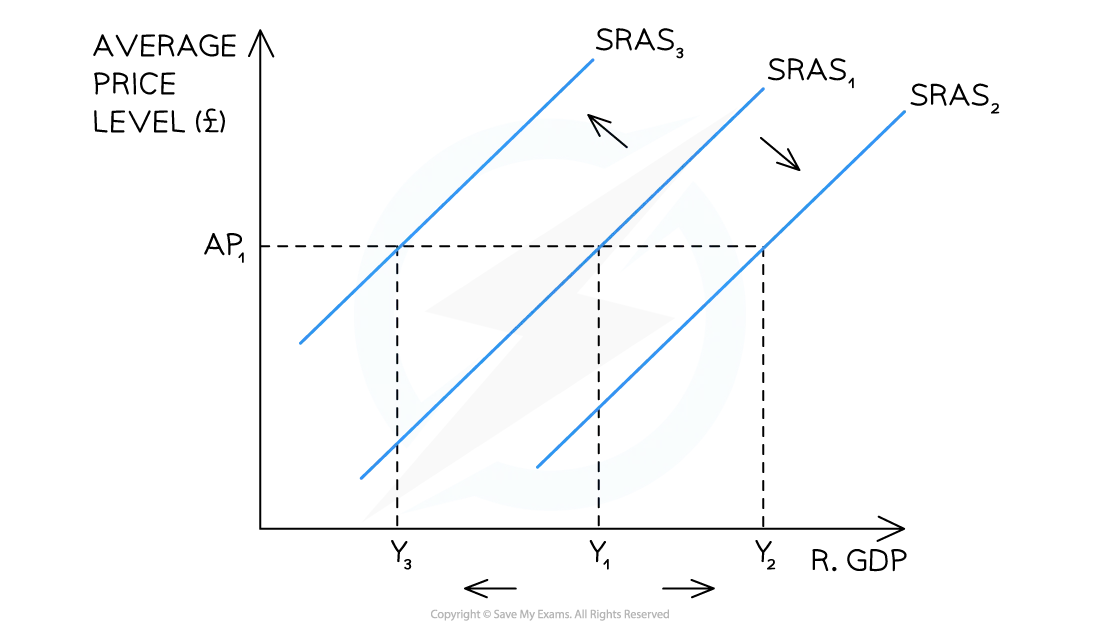
The shift of the entire short-run aggregate supply (SRAS) curve is due to a change in one of the determinants of aggregate supply
Diagram analysis
-
Shifts in SRAS are caused by changes in the conditions of supply - this means changes in the costs of production or productivity
-
A decrease in costs or increase in productivity results in a shift right of the entire curve from SRAS1 → SRAS2
- At every price level, output and real GDP have increased from Y1 → Y2
-
An increase in costs or decrease in productivity results in a shift left of the entire curve from SRAS1 → SRAS3
- At every price level, output and real GDP have decreased from Y1 → Y3
-
Exam Hint Always distinguish between a movement along the SRAS curve and a shift of the SRAS curve. A change in the average price level causes a movement along - a change in any determinant of supply (costs, wages, tax rates, exchange rates, productivity) causes the whole curve to shift.
For shift questions, always identify the effect on costs of production first, then state the direction of the shift and the impact on real output at every price level. The exchange rate determinant is frequently tested and often missed - a depreciation raises import costs, shifting SRAS left even if domestic conditions are unchanged.
The determinants of short-run aggregate supply
- Whenever there is a change in the conditions of supply in an economy, there is a shift of the entire SRAS curve
- The key determinants are changes in costs of production and productivity
| Factor | Explanation | Impact on SRAS |
|---|---|---|
| Cost of raw materials and energy | - A rise in input costs means fewer goods and services can be produced with the same expenditure; a fall in input costs has the reverse effect | - Rise in costs - curve shifts left; fall in costs - curve shifts right |
| Wage rates | - Wages are the largest cost for most firms; a rise in wages increases costs of production and reduces output at every price level; a fall in wages has the reverse effect | - Rise in wages - curve shifts left; fall in wages - curve shifts right |
| Tax rates on firms | - Taxes represent an additional cost of production; a rise in tax rates increases costs and reduces output; a cut in tax rates has the reverse effect | - Rise in taxes - curve shifts left; cut in taxes - curve shifts right |
| Exchange rates | - A depreciation of the exchange rate raises the cost of imported raw materials and energy, increasing production costs; an appreciation has the reverse effect | - Depreciation - curve shifts left; appreciation - curve shifts right |
| Productivity | - A rise in productivity means more output can be produced from the same inputs, reducing unit costs; a fall in productivity has the reverse effect | - Rise in productivity - curve shifts right; fall in productivity - curve shifts left |
Case Study The impact of sterling depreciation on UK SRAS - Brexit 2016
The context
In June 2016, the UK voted to leave the European Union. The result triggered an immediate and sharp depreciation of sterling - the pound fell by approximately 10-15% against the US dollar and euro within days of the referendum result, reaching its lowest level against the dollar in over 30 years.
The transmission to SRAS
The UK economy is heavily dependent on imported raw materials, energy and intermediate goods. When sterling depreciated:
- The cost of importing raw materials and energy rose sharply in pound terms
- Manufacturing and production costs increased across the economy as a result
- Rising input costs shifted SRAS to the left - firms could supply less output at every price level
The outcome
- UK inflation rose from around 0.5% in mid-2016 to over 3% by late 2017, driven in part by higher import costs feeding through into production prices
- The Office for National Statistics noted that import price inflation was a significant contributor to the rise in the Consumer Prices Index during this period
- Real wages fell as price inflation outpaced wage growth - households faced a squeeze on purchasing power
What this illustrates
The Brexit depreciation is a clear real-world example of a negative supply shock - a currency movement that raised production costs and shifted SRAS left, generating cost-push inflation without any increase in productive capacity. It also illustrates that exchange rate changes affect both AD (via net exports) and SRAS (via import costs) simultaneously - making the overall macroeconomic effect difficult to predict with precision.

Was this revision note helpful?
Build on this topic