Subsidies (Cambridge International A-Level Economics)
Subsidies
- A subsidy is a payment made by the government to producers to reduce the cost of production
- Governments frequently use subsidies to encourage production or consumption of merit goods such as energy-efficient products, electric vehicles, healthcare, and education
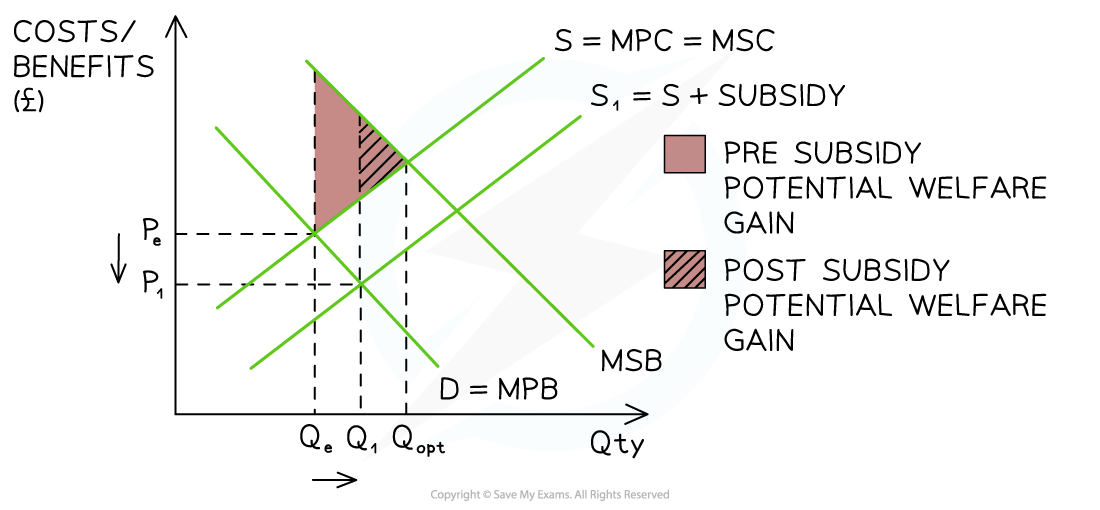
How a subsidy reduces the welfare loss (or generates a welfare gain)
Diagram analysis
-
The free-market equilibrium is at PeQe - where MPB = MSC
- Market failure exists as MSB > MSC at the free market equilibrium, meaning the good is under-consumed
- Optimum level of output is at Qopt
-
A subsidy shifts the supply curve right from S → S1
-
It does not completely eradicate the potential welfare gain but moves the market closer to the optimum level of output (Qopt)
-
The potential welfare gain has been reduced as shown in the diagram
- This represents a reduction in deadweight loss and an improvement in allocative efficiency
-
-
The new market equilibrium is at P1Q1
- This is a lower price and higher output
- There is less under-consumption and so less market failure
- Some of the external benefits available have been realised
Subsidy incidence
-
The incidence (share) of the subsidy is determined by the PED of the product
- If governments subsidise goods or services with high PED, the increase in QD will be more than proportional to the decrease in price
- Producers keep some of the subsidy and pass the rest on to the consumers
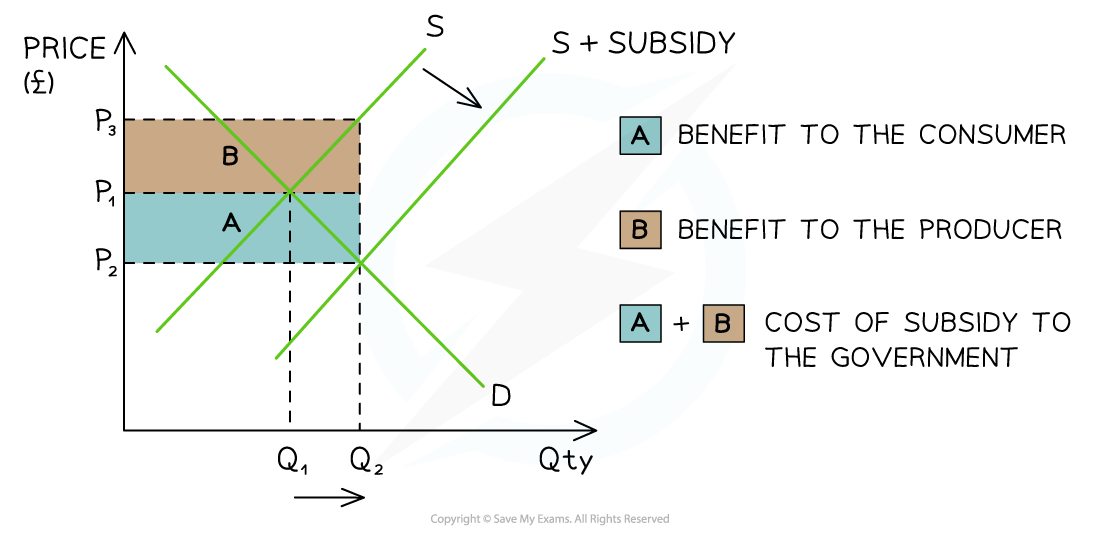
A diagram which demonstrates the cost of a subsidy to the government (A+B) and the incidence received by the consumer (A) and producer (B)
Diagram analysis
-
The original equilibrium is at P1Q1
-
The subsidy shifts the supply curve from S → S + subsidy:
- This increases the QD in the market from Q1→Q2
- The new market equilibrium is P2Q2
- This is a lower price and higher QD in the market
-
Producers receive P2 from the consumer PLUS the subsidy per unit from the government
- Producer revenue is therefore P3x Q2
- Producer incidence of the subsidy is marked B in the diagram
-
The subsidy decreases the price that consumers pay from P1 → P2
- Consumer incidence of the subsidy is marked A in the diagram
-
The total cost to the government of the subsidy is (P3 - P2) x Q2 represented by area A+B
- This creates an opportunity cost, as government funds could be used for alternative purposes
Exam Hint When dealing with a subsidy, the producer benefit is now the top portion of the incidence area, and consumer incidence is below
The effectiveness of subsidies
-
Estimating the appropriate size of a subsidy can be difficult
-
Many subsidies are applied uniformly, meaning they are not linked to consumers’ income levels or ability to pay. Unlike income-based taxes or benefits, subsidies usually reduce the price by the same amount for all users
-
As a result, both higher-income and lower-income consumers benefit equally per unit consumed, even though the policy may be intended to support those on lower incomes
- This makes it important to consider who actually gains from a subsidy
Examples
1. Domestic energy subsidies
- In some countries, governments subsidise electricity or gas to keep household energy bills affordable
- While this can help low-income households cope with rising living costs, wealthier households also benefit, often to a greater extent because they consume more energy
- In addition, lower prices may increase demand, leading to supply pressures or higher government spending.
- If subsidies are paid directly to energy suppliers, there is no guarantee that firms will become more efficient or invest in cleaner technologies
2. Subsidies for education and training
- Governments often subsidise further education or vocational training to improve workforce skills and productivity
- These subsidies can increase access to education and benefit society through higher employment and economic growth
- However, some of the financial benefits may go to individuals who could afford training without support, raising questions about whether the subsidy is well targeted
Exam Hint A great evaluation point is that:
There is no guarantee that subsidies will fully correct market failure, as firms may not pass on the full benefit to consumers
Taxes vs Subsidies (Comparison)
- Taxes discourage consumption and production, while subsidies encourage them
| Feature | Indirect tax | Subsidy |
|---|---|---|
| Effect on supply | - Shifts left (S → S + tax) | - Shifts right (S → S + subsidy) |
| Effect on price | - Increases price for consumers | - Decreases price for consumers |
| Effect on output | - Reduces quantity traded | - Increases quantity traded |
| Market failure targeted | - Negative externalities (demerit goods) | - Positive externalities (merit goods) |
| Welfare effect | - Reduces over-consumption | - Reduces under-consumption |
| Government finances | - Generates tax revenue | - Creates a cost to the government |
| Incidence | - Split between consumers and producers depending on elasticity | - Split between consumers and producers depending on elasticity |
Was this revision note helpful?