Understanding Price Stability (Cambridge International A-Level Economics)
Inflation, deflation and disinflation
-
Inflation is the sustained increase in the average price level of goods and services in an economy
-
Deflation occurs when there is a fall in the average price level of goods and services in an economy
- Deflation is a negative rate of inflation, not simply a slowing rate
-
Disinflation occurs when the average price level increases but at a decreasing rate than before
- These figures demonstrate disinflation: Y1 = 5% Y2 = 4% Y3 = 2%
UK inflation, disinflation and deflation
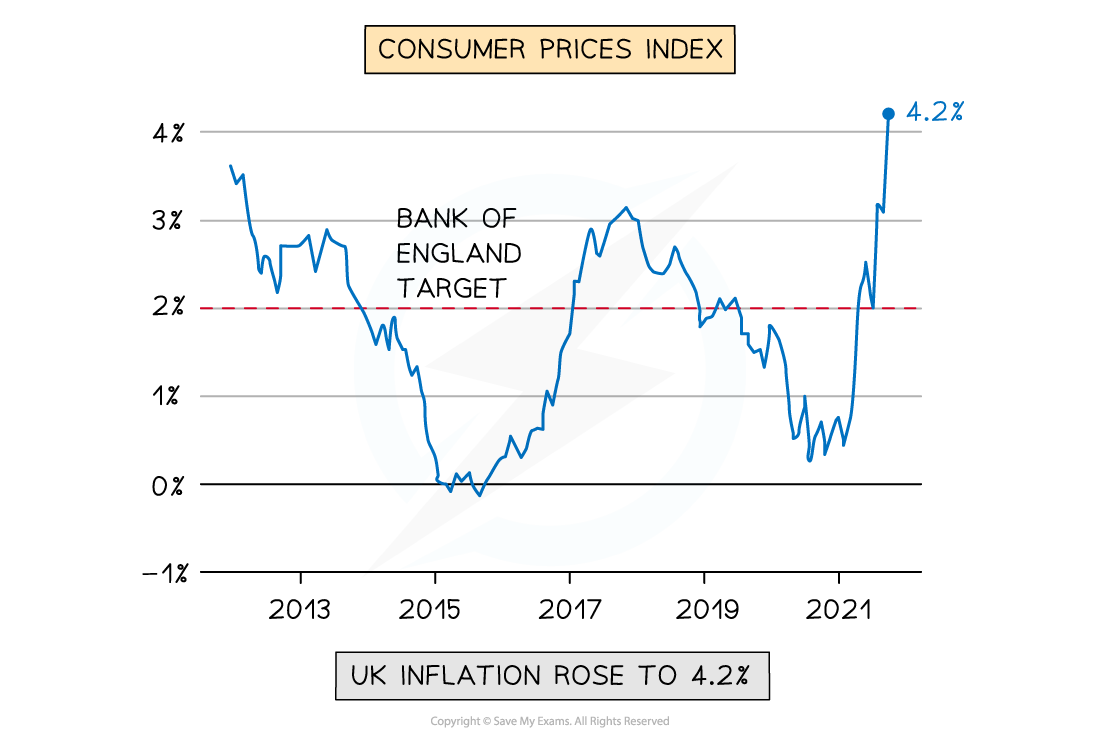
Between 2013 and 2015, the UK experienced disinflation, with inflation falling from 3.5% to just on 0%. From 2021, it experienced sustained inflation, rising to 4.2%
The distinction between nominal and real data
-
Nominal values are measured in current prices
- They make no adjustment for inflation and therefore reflect both changes in the volume of output and changes in the price level
-
Real values are adjusted for inflation using a price index
- They strip out the effect of price changes and reflect only changes in the actual volume of goods and services
-
The distinction matters because nominal figures can be misleading - a rise in nominal wages does not mean workers are better off if prices have risen by the same amount or more
- A worker whose nominal wage rises by 3% when inflation is 5% has experienced a fall in real wages of approximately 2%
- Real wages measure purchasing power - what the wage can actually buy
-
Converting nominal to real values can be done using the following formula:
Worked Example Calculate real GDP if nominal GDP is $550 billion and the price index is 110
Step 1 - Substitute values into the formula
$\text{Real} \text{GDP} = \frac{Nominal GDP}{Price index} \mathrm{x} 100
\text{Real} \text{GDP} = \frac{550}{110} \mathrm{x} 100
\text{Real} \text{GDP} = $ 500 \text{bn}$
| Measure | What it shows | Problem |
|---|---|---|
| Nominal wage | - Wage in current prices | - May overstate improvement in living standards if inflation is high |
| Real wage | - Wage adjusted for inflation | - True measure of purchasing power |
| Nominal GDP | - Total output in current prices | - Rises with inflation even if output is unchanged |
| Real GDP | - Total output in constant prices | - True measure of economic growth |
Causes of inflation
- An increase in the average prices in an economy can be caused by demand pull inflation or cost push inflation
1. Demand pull inflation
-
Demand pull inflation is caused by excess demand in the economy
-
Aggregate demand (AD) is the sum of all expenditure in the economy
- AD = Consumption (C) + Investment (I) + Government spending (G) + Net Exports (X-M)
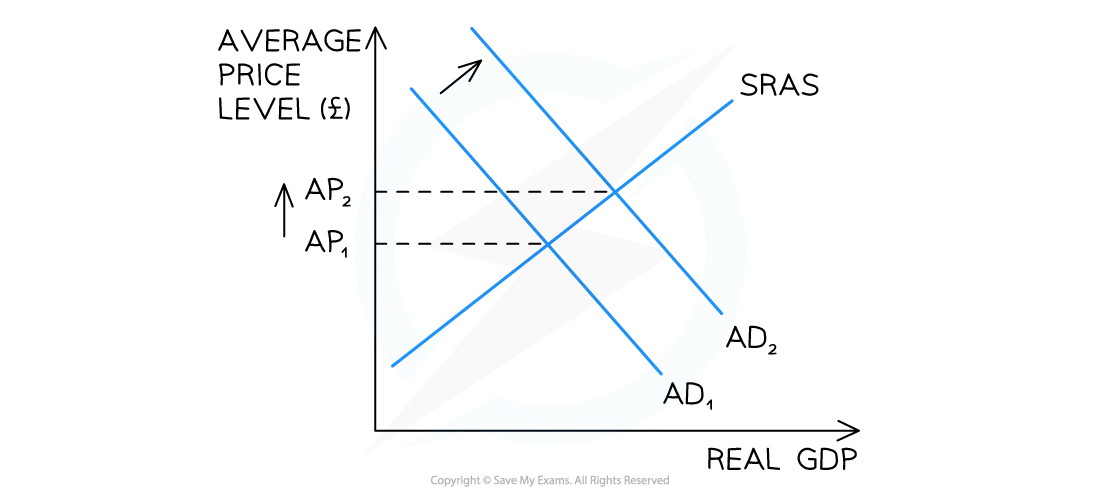
*An increase in aggregate demand (AD) raises the average price level in an economy *
Diagram analysis
-
If any of the four components of AD increase, there will be a shift to the right of the AD curve from AD1 → AD2
-
At the original price (AP1), there is now a condition of **excess demand **in the economy (extend the dotted line across until it hits the new demand curve to identify the excess demand)
-
Prices for goods/services are bid up from AP1 → AP2
-
Demand pull inflation has occurred
-
If the Central Bank lowers the base rate, there is likely to be increased** borrowing** by firms and consumers
-
Lower interest rates - lower cost of borrowing - higher consumption and investment - AD shifts right - demand-pull inflation
- This will result in an increase in consumption and investment
-
2. Cost push inflation
- Cost push inflation is caused by increases in the costs of production in an economy
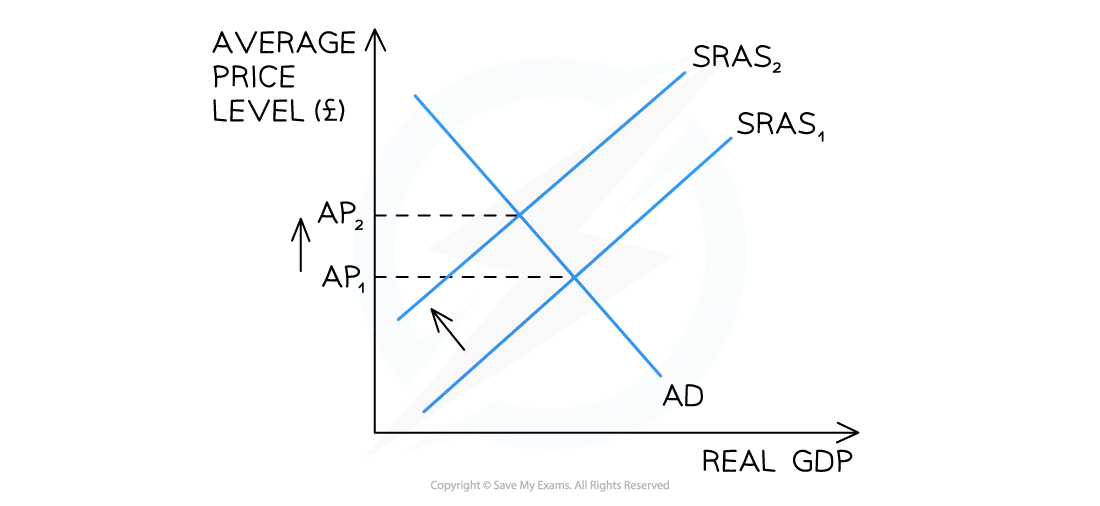
*An increase in the costs of production raises the average price level in an economy, leading to cost push inflation *
Diagram analysis
- If any of the costs of production increase (labour, raw materials etc.), or if there is a fall in productivity, there will be a shift to the left of the SRAS curve from SRAS1→SRAS2
- At the original price (AP1), there is now a condition of excess demand in the economy
- As prices rise, there is a contraction of AD and an extension of SRAS
- Prices for goods/services are bid up from AP1→AP2
- Cost push inflation has occurred
Exam Hint For the AD/AS diagram, always identify whether inflation is demand-pull or cost-push before drawing - the diagrams look different.
Demand-pull shows AD shifting right with both output and price level rising; cost-push shows SRAS shifting left with the price level rising but output falling. The output effect is the key distinction - demand-pull raises output while cost-push reduces it.
The consequences of inflation
Spec point —
4.6.5
- The consequences of inflation are different for different stakeholders in the economy
- The consequences are also dependent on the household level of wealth and income
The impact of inflation on different stakeholders
| Stakeholder | Explanation of Impact |
|---|---|
| Firms | - Rapid price changes create uncertainty and delay investment - Shoe leather costs and menu costs- Shoe leather costs (the cost of moving money around to minimise the impact of inflation) and menu costs (the cost to firms of constantly updating prices) increase |
| Consumers | - Decrease in purchasing power - Decrease in the real value of savings (as money will be worth less in real terms) - Fall in real income for those on **fixed incomes or pensions - Inflation is more harmful to low income households - Redistribution effects - inflation redistributes wealth from creditors to debtors, since the real value of debt falls |
| Government | - Inflation erodes international competitiveness of export industries, as the country's exports are now relatively more expensive - Economic growth may slow due to a fall in exports and a possible fall in consumption -** Trade-offs **involved in tackling inflation, e.g reducing inflation may increase unemployment and/or reduce economic growth |
| Workers | -** Demand higher wages to compensate for reduced purchasing power - If wage increases ≠ inflation, motivation and productivity may fall |
Was this revision note helpful?
Build on this topic