Income Distribution (Cambridge International A-Level Economics)
Inequality
-
Income and wealth inequality are two different concepts
- Income inequality refers to the unequal distribution (flow) of income to households i.e rent, wages, interest and profit
- Wealth inequality refers to differences in the amount of assets that households own
-
The two main measures of income inequality are the Lorenz Curve and the Gini coefficient
The Lorenz curve
-
The Lorenz curve is defined as a graphical representation of income distribution showing the cumulative share of total income received by cumulative shares of the population, ranked from poorest to richest
- The horizontal axis shows the cumulative percentage of the population (0–100%), ranked from lowest to highest income
- The vertical axis shows the cumulative percentage of total income received by that share of the population
- The line of perfect equality is a 45-degree diagonal - at every point, x% of the population earns exactly x% of total income
- The Lorenz curve always lies below the line of perfect equality (except at the endpoints 0,0 and 100,100) - the further it bows away from the diagonal, the greater the inequality
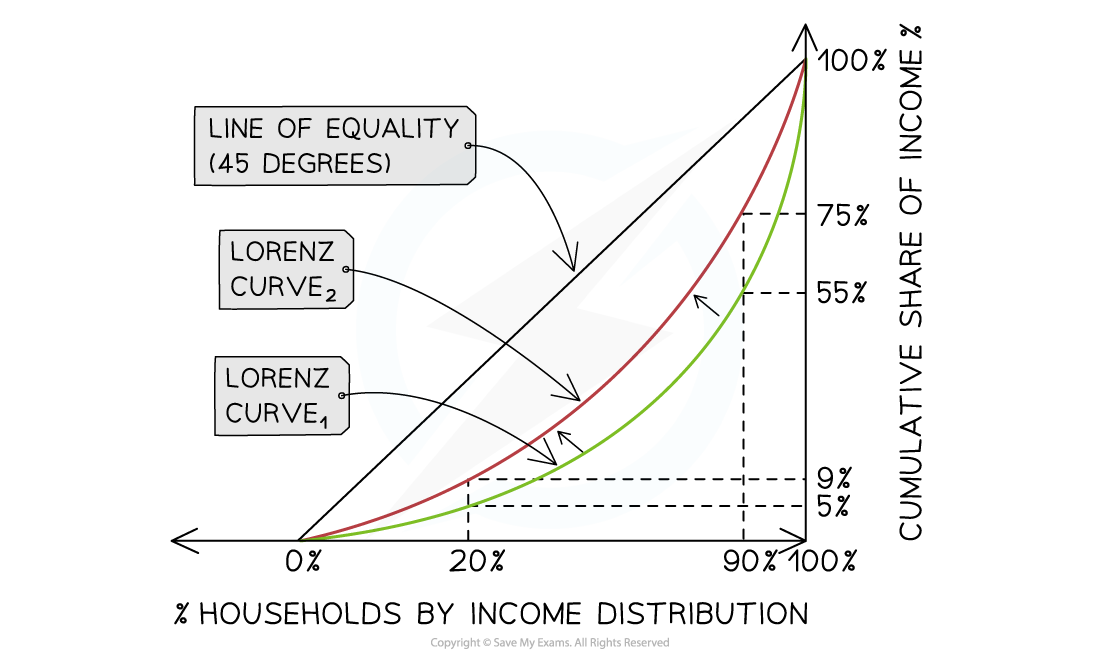
Lorenz curve for the UK (green line) and Sweden (red line). The income distribution in the UK is more unequal than that of Sweden
Diagram analysis
-
The line of equality represents perfect income distribution
-
Comparing two countries: the country whose Lorenz curve lies closer to the diagonal has the more equal distribution
-
If two Lorenz curves intersect, neither country can be said to have unambiguously greater inequality
- In the UK the bottom 20% of households receive 5% of the income flow, while in Sweden they receive 9% of the income flow
- In the UK the top 10% of households receive 45% of the income flow, while in Sweden they receive 25%
- Sweden has a more equal distribution of income than the UK
The Gini coefficient
- The Gini coefficient is defined as a numerical measure of income inequality derived from the Lorenz curve, calculated as the ratio of the area between the line of perfect equality and the Lorenz curve to the total area under the line of perfect equality
- The formula is:
Gini coefficient = A / (A + B)
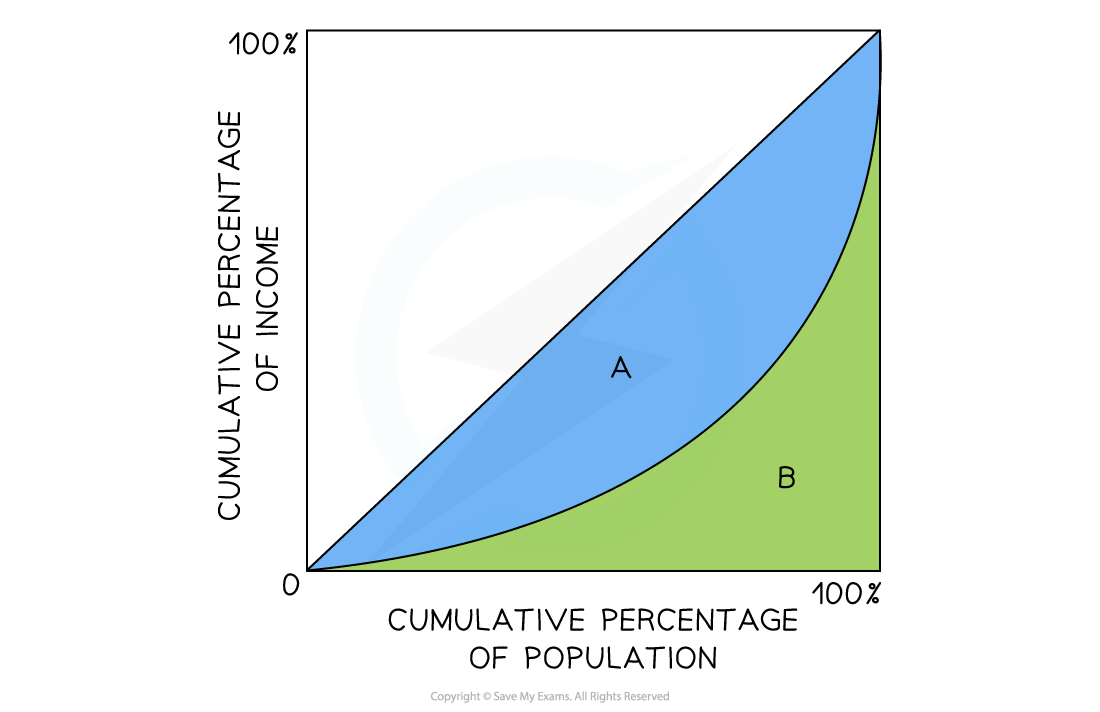
How the Gini Coefficient is calculated
- Where A = area between the line of perfect equality and the Lorenz curve, and B = area below the Lorenz curve
- The Gini coefficient ranges from 0 to 1
| Value | Interpretation |
|---|---|
| 0 | - Perfect equality - every person receives an identical share of income |
| Closer to 0 | - Relatively equal distribution |
| Closer to 1 | - Relatively unequal distribution |
| 1 | - Perfect inequality - one person receives all income |
- In practice, Gini coefficients typically range from around 0.25 (highly equal, e.g. Scandinavia) to above 0.60 (highly unequal, e.g. South Africa)
- A falling Gini coefficient over time indicates that income distribution is becoming more equal; a rising coefficient indicates widening inequality
Limitations of the Gini coefficient
| Limitation | Explanation |
|---|---|
| Single summary statistic | - Two countries can have identical Gini coefficients but very different distributions - The coefficient does not reveal where in the distribution inequality is concentrated |
| Ignores absolute income levels | - A country with a low Gini but very low average incomes may have worse absolute poverty than a country with a higher Gini and much higher average incomes |
| Does not capture wealth inequality | - Income and wealth distributions often differ significantly - The Gini measures income flows, not accumulated assets |
| Data reliability | - In low-income economies, income data from household surveys is often incomplete, particularly for informal sector workers and subsistence farmers |
| Intersecting Lorenz curves | - When two countries' Lorenz curves cross, a single Gini coefficient cannot determine which country has greater overall inequality |
Worked Example What indicates that a more equal distribution of income has been achieved?
A A faster rate of economic growth B A higher Human Development Index C A lower Gini coefficient D A lower tax / GDP ratio Final answer: Answer: C
The Gini coefficient directly measures income inequality - a lower value means income is more equally distributed, so C is the only option that definitively indicates greater equality
Worked solution
- Option A is incorrect — faster growth can widen inequality if gains are concentrated at the top, as the Kuznets curve illustrates
- Option B is incorrect — the HDI measures health, education and income but not distribution; a high HDI can coexist with high inequality
- Option D is incorrect — a lower tax/GDP ratio generally implies less redistribution, which would tend to increase rather than decrease inequality
Exam Hint The most common error is confusing the Gini coefficient with the Lorenz curve - the Lorenz curve is the diagram, the Gini is the number derived from it.
Examiners frequently ask students to interpret a change in the Gini over time or compare two countries; always link the direction of change to a specific cause, such as government redistribution policy, wage growth at the top, or changes in tax progressivity.
The strongest evaluation point is that a falling Gini does not necessarily mean poverty has fallen - inequality and absolute poverty are distinct concepts.
Was this revision note helpful?
Build on this topic