The Kuznets Curve (Cambridge International A-Level Economics)
The Kuznets curve
-
The Kuznets curve is defined as an inverted U-shaped curve showing the hypothesised relationship between per capita income and income inequality as an economy develops
- Proposed by economist Simon Kuznets in 1955
-
The curve suggests that inequality first rises then falls as a country grows richer, tracing an inverted U shape
The mechanism - three stages
-
Early development (low per capita income)
-
As an economy begins to industrialise, workers move from low-productivity subsistence agriculture into higher-wage urban manufacturing;
- inequality rises because only a small share of the population initially benefits from industrial growth
-
-
Turning point (middle income)
-
Inequality reaches its peak at a critical level of per capita income;
- The benefits of growth are concentrated among a relatively small urban industrial class, while the rural majority remains poor
-
-
Advanced development (high per capita income)
-
As more workers move into the modern industrial and service sectors, wages converge
- Governments also accumulate sufficient tax revenue to fund redistributive policies such as social insurance, public education and progressive taxation - inequality falls
-
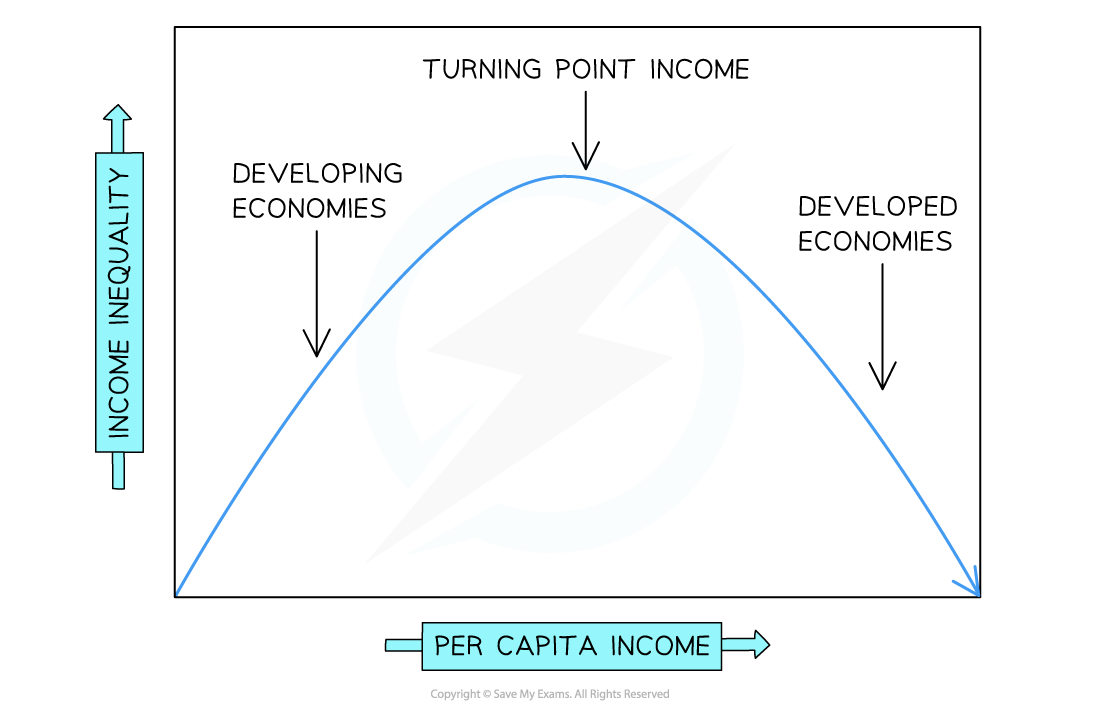
The Kuznets Curve
Diagram analysis
- The y-axis measures income inequality (e.g. the Gini coefficient); the x-axis measures per capita income
- Developing economies sit on the upward-sloping left side of the curve — growth initially worsens inequality
- The turning point income is the peak of the curve — the level of per capita income at which inequality is greatest
- Developed economies sit on the downward-sloping right side — further growth is associated with falling inequality
Evaluation of the Kuznets Curve
| Limitation | Explanation |
|---|---|
| Mixed empirical evidence | - Many countries do not follow the pattern - China has experienced rapid growth alongside persistently high inequality, and some low-income countries have relatively equal distributions |
| Historical bias | - The relationship may reflect patterns in now-developed economies that do not necessarily repeat in today's developing world |
| Role of government policy | - The curve implies a mechanical relationship between growth and inequality - But outcomes depend heavily on institutional quality and deliberate redistribution choices |
| Ignores absolute poverty | - Inequality can fall while many people remain in absolute poverty - The curve measures relative distribution, not the living standards of the poorest |
Worked Example What does the Kuznets curve represent?
A Changes in income inequality over time B Changes in the Human Development Index over time C Changes in the Multidimensional Poverty Index over time D The inverse of a Lorenz curve Answer: A
The Kuznets curve plots income inequality (y-axis) against per capita income (x-axis), showing an inverted U-shaped relationship - inequality rises as a country industrialises then falls as it develops further
Worked solution
- Option B is incorrect - the HDI is a separate composite indicator measuring health, education and income; it has its own trajectory and is not what the Kuznets curve shows
- Option C is incorrect - the MPI measures acute poverty across multiple dimensions; it is not related to the Kuznets curve
- Option D is the most tempting distractor - the Lorenz curve does measure income distribution, but the Kuznets curve is not its inverse; they are entirely different diagrams with different axes
Exam Hint The Kuznets curve is frequently used as an evaluation tool in essays on development - it challenges the assumption that growth automatically reduces inequality.
The strongest evaluation point is that the curve is empirically contested: many developing economies have experienced rising inequality alongside rapid growth without reaching the turning point, suggesting that redistribution requires deliberate policy rather than automatic market forces.
Was this revision note helpful?
Build on this topic